


FXOpen
Both Ether and Dash are still in uptrends. But while Dash gained new ground during the past two weeks, Ether stayed mostly flat.
Ether Prices Mostly Stable After Rally
Ether prices have stayed mostly stable during the past two weeks. We are currently quoted at 0.01148, down by 5 percent compared to our last ETH update. This is not much considering that up to this point prices rallied 50 percent from the lows hit in December.
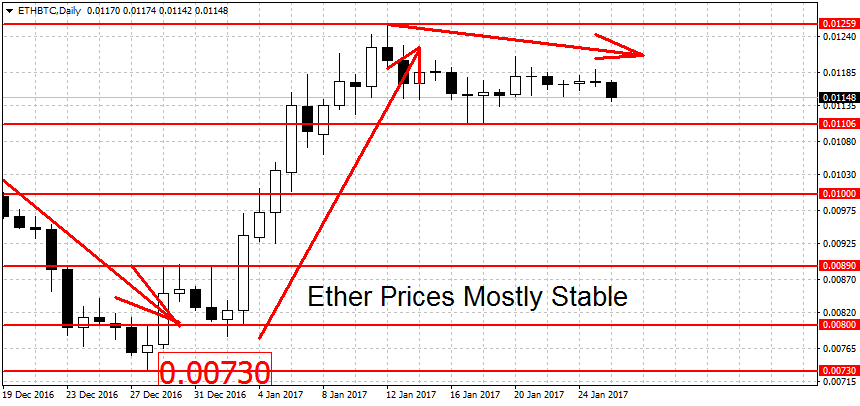
The uptrend remains unbroken as you can see on the chart above. But a decisive breakdown below the 0.01106 swing low could end it. Support below here can be found at at the 0.01 round figure,a move below here could shift the trend from up to down. The former swing highs near 0.0089 BTC could also provide some support to falling prices. The December low at 0.0073 is another potential support, followed by the semi-round figure at 0.05 BTC.
On the upper side we have resistance at this month’s high of 0.01259. Higher up we have more resistance at 0.01332 BTC, closely followed by the 0.01382 swing high and the 0.015 round figure. While the short-term (daily) trend is bullish here, the weekly trend remains bearish.
Dash Gains More Ground
Dash prices gained more ground during the past 14 days. We are currently trading at 0.01609, around 7.7 percent higher.
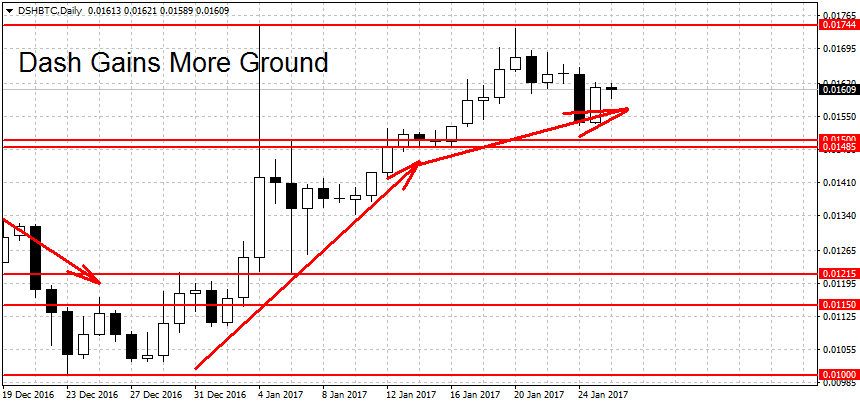
Dash is still in rally mode. To end it, the bulls will have to push prices below the 0.01485 swing low. We have support below here at the 0.01215 swing low. A decisive break below here could start a new downtrend. More support can be found at 0.01104, followed by a strong support level at the 0.01 BTC round figure. This is near last year’s low for DSH/BTC (0.01003). A breakdown below here could intensify the losses.
On the upper side, the double top near 0.01744 remains key. A successful breakout above it could propel Dash higher. The longer-term trends are still undecided, with both the weekly and the monthly charts in neutral mode.
Bitcoin Edges Higher
Bitcoin prices have edged higher during the past two days, from $900 to $905 dollars per coin. Prices remain range-bound. A new uptrend requires a decisive breakout above the $925 swing high, while a new downtrend needs a move below the $748 swing low. Note that the fundamental picture for bitcoin remains bleak, as we have outlined in our previous BTC article.
FXOpen offers the world's most popular cryptocurrency CFDs*, including Bitcoin and Ethereum. Floating spreads, 1:2 leverage — at your service. Open your trading account now or learn more about crypto CFD trading with FXOpen.
*At FXOpen UK and FXOpen AU, Cryptocurrency CFDs are only available for trading by those clients categorised as Professional clients under FCA Rules and Professional clients under AFSL 412871 – ABN 61 143 678 719 respectively. They are not available for trading by Retail clients.
This article represents the opinion of the Companies operating under the FXOpen brand only. It is not to be construed as an offer, solicitation, or recommendation with respect to products and services provided by the Companies operating under the FXOpen brand, nor is it to be considered financial advice.
Stay ahead of the market!
Subscribe now to our mailing list and receive the latest market news and insights delivered directly to your inbox.

Latest articles

Coca-Cola (KO) Share Price Drops Sharply After Earnings Report
On 23 October, Coca-Cola (KO) released its third-quarter earnings, which exceeded forecasts:
→ Earnings per share (EPS): Actual = $0.77; Expected = $0.74
→ Gross revenue: Actual = $11.95 billion; Expected = $11.69 billion
Despite these positive results, KO's share price saw
ETH/BTC Hits 44-Month Low
The ETH/BTC exchange rate has reached its lowest level in 44 months, as shown on the ETH/BTC chart, indicating that in 2024, cryptocurrency investors seem to favour Bitcoin over Ethereum.
The downward trend, shown by the red channel,
What Is a Doji Candle, and How Can You Use It in Trading?
A Doji candle is a technical analysis tool reflecting the uncertainties in the market. Although it provides strong signals, it should be used with other patterns or technical indicators. Why do traders look for Dojis when trading stocks, commodities, and