


ETHUSD and LTCUSD Technical Analysis – 03rd MAR, 2022
FXOpen

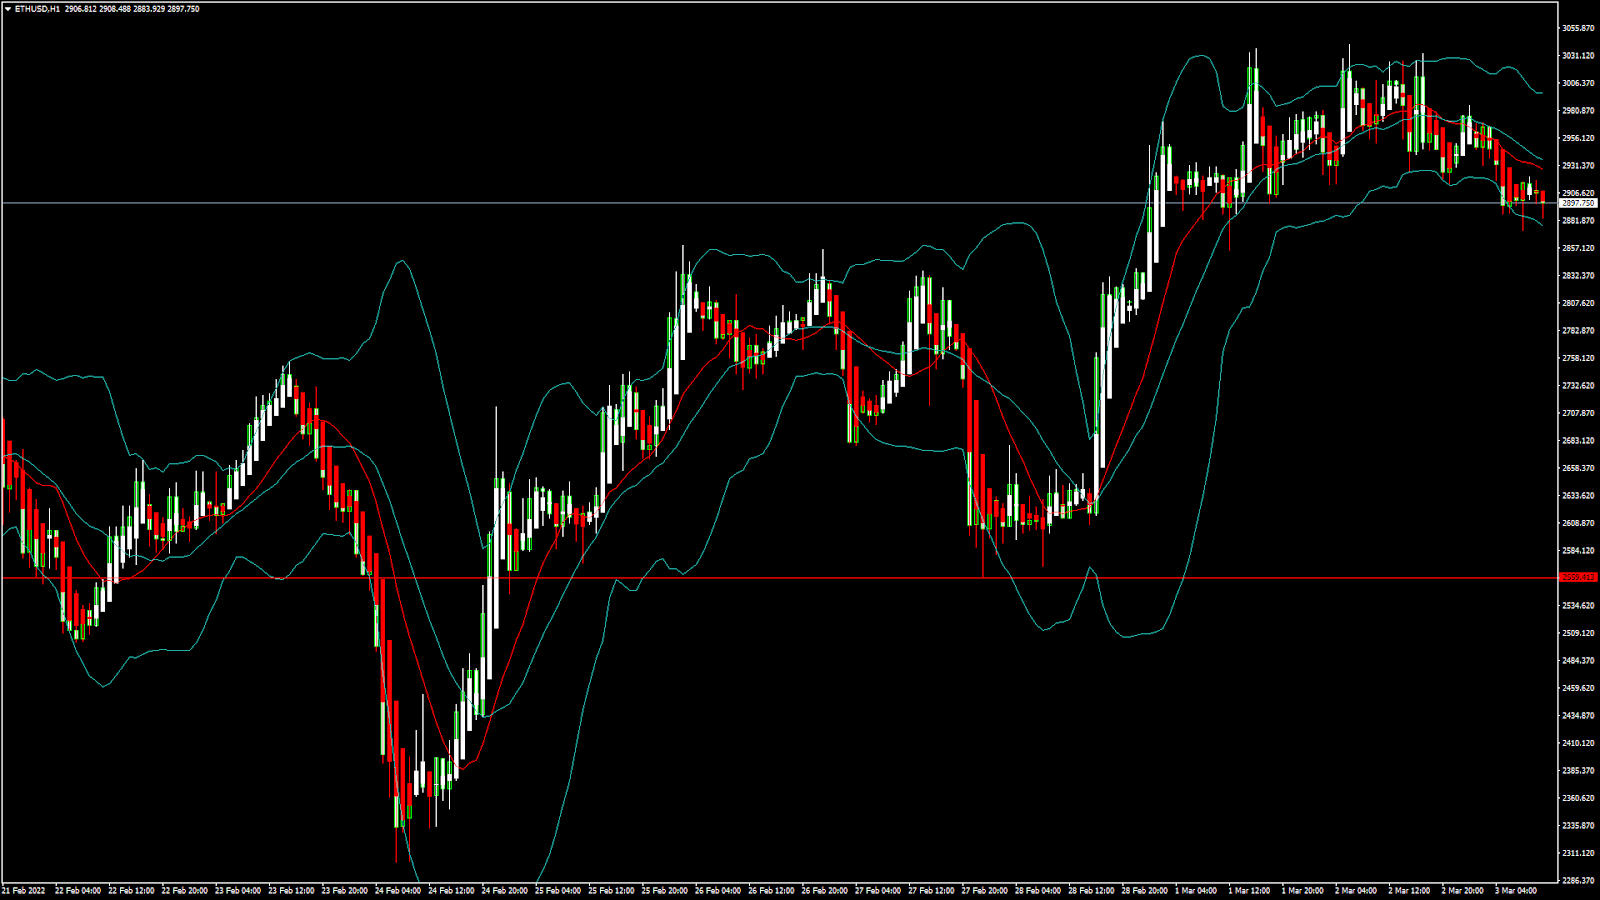
ETHUSD: Bullish Engulfing Pattern above $2,550
Ethereum had a major bearish correction last month when it declined below the $3,000 handle after touching a high of $3,268 on February 9th.
This week, ETHUSD started in the consolidation phase after which it had a bullish reversal towards the $2,700 handle and touched an intraday high of $2,982 in today’s Asian trading session.
We can clearly see a bullish engulfing pattern above $2,550 which signifies a trend reversal, and we have already seen ETHUSD crossing the level of $2,700.
We saw the price of Ethereum retracting from its highs due to some profit taking, but the bullish channel continues now, and we are aiming for the upside of $2,900 and $3,100 in this week.
ETH is now trading just below its pivot level of $2,967 and moving in a mildly bullish momentum. The price of ETHUSD is now facing its classic resistance level of $3,020 and its Fibonacci resistance level of $3,094, and is now aiming towards the $3,100 handle in the US trading session.
The moving averages are giving a BUY signal.
ETH is now trading below both the 100 hourly and 200 hourly simple moving averages.
- Ethereum is in a mildly bullish channel
- A short-term trend reversal seen above $2,550
- All the major technical indicators are giving NEUTRAL-to-BUY signals
- The average true range is indicating LESSER market volatility
Ether: Bullish Channel Towards $3,000 Confirmed
ETHUSD is consolidating its gains above $2,700 in the European trading session, and we can clearly see that the bullish channel is back.
We are now aiming for the upsides of $2,900 to $3,100 today in the US trading session today. The retracement from $2,300 was very strong — which suggests that there is more room for the upsides in Ethereum this month, and the level of $3,500 is the next target.
We can see the MA crossover pattern above the level of $2,850 which means that in the immediate short-term, we will see the continuation of the bullish channel.
ETH has declined -3.47% with a price change of -103.91$ in the past 24hrs, and has a trading volume of 14.424 billion USD.
We can see a decrease of 26% in the trading volume as compared to yesterday, which means that new buyers are now entering the markets and waiting for further correction in Ethereum.
The Week Ahead
Ether is printing above $2,800 today, and we can see levels of $3,000 to $3,200 this week.
The medium-to-long term outlook for Ether remains Bullish with targets of above $3m500 in March, 2021.
Ether has already broken its major resistance level of $2,800, and is now facing the next resistance level of $3,000.
Technical Indicators:
The commodity channel index (14-day): at 94.58 indicating a BUY
The moving averages convergence divergence (14-day): at 3.79 indicating a BUY
The ultimate oscillator: at 53.45 indicating a BUY
The rate of price change: at 0.052 indicating a BUY
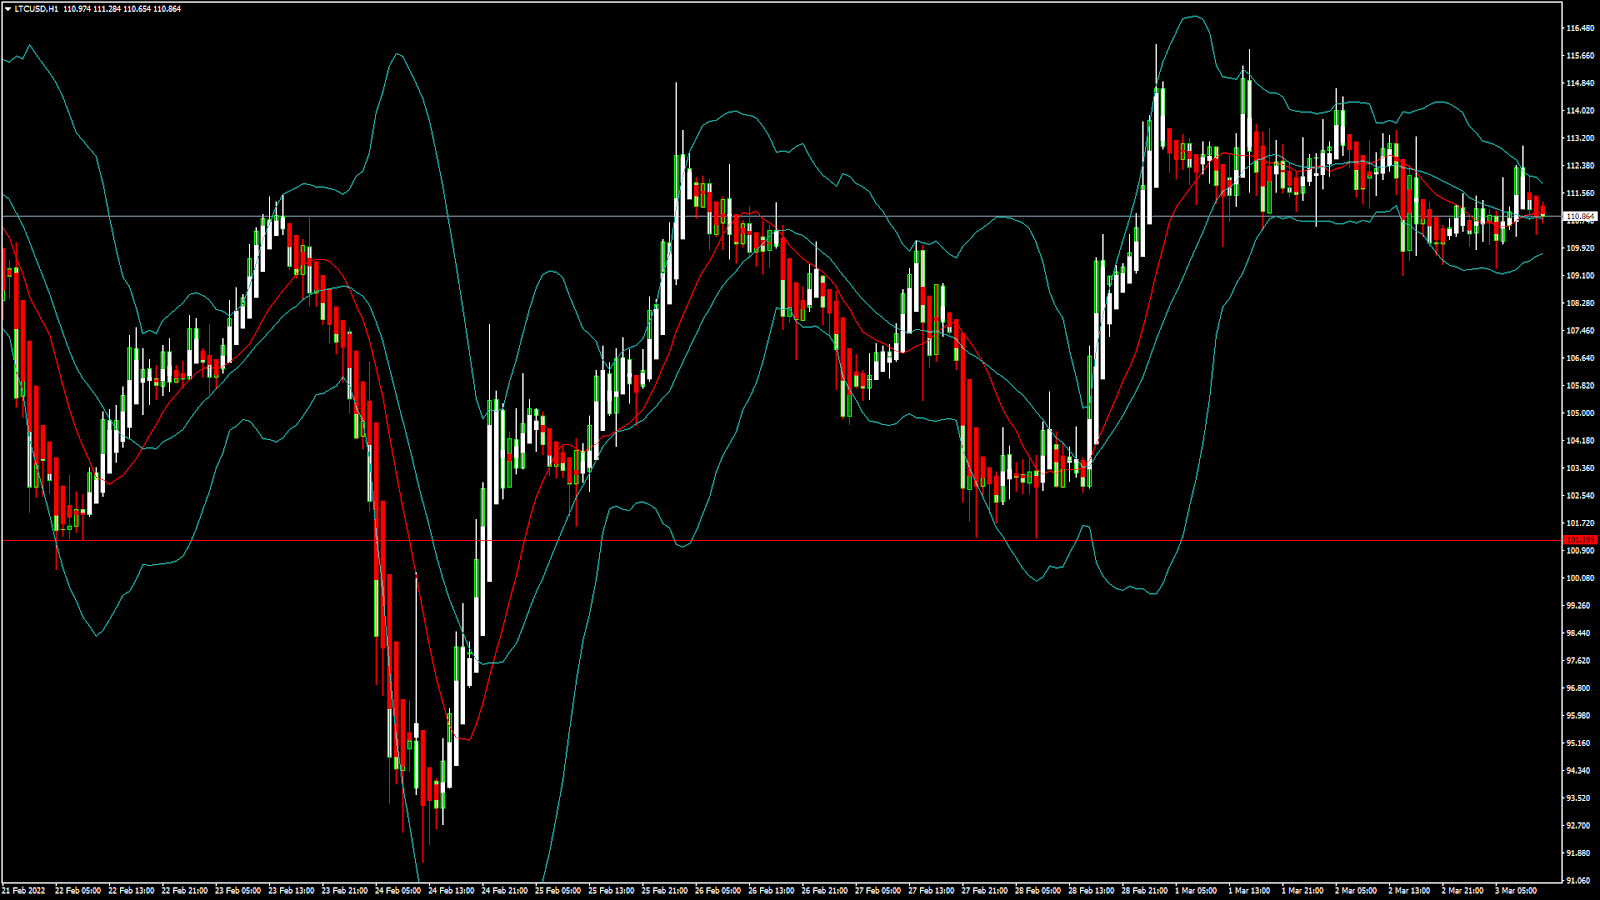
LTCUSD: Bullish Engulfing Pattern Above $101
Litecoin had a major bearish correction last week and touched a low of $91 on February 24th after which we could see a mildly bullish momentum towards the $110 handle.
We can see a bullish engulfing pattern today above the $101 level which signifies a bullish trend reversal; we are now aiming for the upside of $110 in the US trading session today. This is in continuation of the bullish channel that we saw last week, and now we are looking for immediate targets of $120 to $125.
We can see an increase in the bullish momentum seen last week which is a positive signal for fresh buyers.
Litecoin is now trading just above its 100 hourly simple moving average, and just below its 200 hourly exponential moving averages. The price of LTCUSD has already broken its pivot level of 110.80.
The immediate short-term outlook for Litecoin has turned bullish.
- The medium to long-term outlook for Litecoin remains bullish
- All the MOVING AVERAGES are giving a BUY signal
- A confirmed uptrend is seen in medium-term range above $10
- The average true range is indicating LESSER market volatility
Litecoin: Bullish Momentum Above $100 Confirmed
The price of Litecoin has come out of the consolidation phase today and is now moving in a mildly bullish channel above the $100 handle in the European trading session.
We can see that after touching the levels of 111.42, a contraction in its prices is expected as seen from the MA5 crossover pattern.
The price of LTCUSD is now facing its classic resistance level of 111.30 and Fibonacci resistance level of 111.60, after which the path towards $120 will get cleared.
We have seen a 20-day SMA crossover which also signifies the shift in the trends towards the bullish channel.
Litecoin’s trading volume has decreased by 16.80% as compared to yesterday which means that fresh buyers are still waiting for a trend confirmation.
In the last 24hrs, LTCUSD has declined by -1.30% with a price change of 1.46$, and has a 24hr trading volume of 0.779 billion USD.
The Week Ahead
Litecoin is witnessing decreased trading volumes today as compared to yesterday. We can see the prices of LTCUSD entering into a consolidation phase above the $100 handle.
At present market levels we can see a mildly bullish channel which is expected to keep the prices of Litecoin above the $100 handle.
We will need to wait and see if the prices of LTCUSD continue to remain above the $100 mark then fresh buying could be expected. It is also possible for the prices to continue moving in a narrow range between the levels of $110 and $115.
The weekly outlook is projected at $120 with a consolidation zone of $115.
Technical Indicators:
The ultimate oscillator: at 55.00 indicating a BUY
Stoch (9, 6): at 55.85 indicating a BUY
StochRSI (14): at -50.10 indicating a NEUTRAL level
The average directional index (14-day): at 16.97 indicating a NEUTRAL level
FXOpen offers the world's most popular cryptocurrency CFDs*, including Bitcoin and Ethereum. Floating spreads, 1:2 leverage — at your service (additional fees may apply). Open your trading account now or learn more about crypto CFD trading with FXOpen.
*Important: At FXOpen UK, Cryptocurrency trading via CFDs is only available to our Professional clients. They are not available for trading by Retail clients. To find out more information about how this may affect you, please get in touch with our team.
This article represents the opinion of the Companies operating under the FXOpen brand only. It is not to be construed as an offer, solicitation, or recommendation with respect to products and services provided by the Companies operating under the FXOpen brand, nor is it to be considered financial advice.
Stay ahead of the market!
Subscribe now to our mailing list and receive the latest market news and insights delivered directly to your inbox.


Latest articles

DAX 40: consolidation amid technology sell-off
A wave of selling in the technology sector that emerged earlier this week has weighed on European equities. The trigger was investor concern over the profitability of large-scale debt-funded investments by major US tech companies in AI infrastructure. The Nasdaq

Euro Hits Fresh Yearly Lows Amid Dovish ECB Signals
The euro remains under pressure following weak macroeconomic data from the euro area and fresh signals that the European Central Bank is prepared to maintain a more accommodative monetary policy stance. Data released yesterday pointed to a deterioration in business

Pound at Key Levels: Markets Assess Impact of Political Uncertainty in the UK
The British pound remains under pressure following increased political uncertainty in the United Kingdom triggered by the Prime Minister’s resignation. Investors are assessing potential shifts in the political and economic policy outlook after the head of government stepped down,