


FXOpen

Bears couldn’t keep control of the market, and ETH/USD started to correct upwards after touching a low of $1,763 on 9 April.
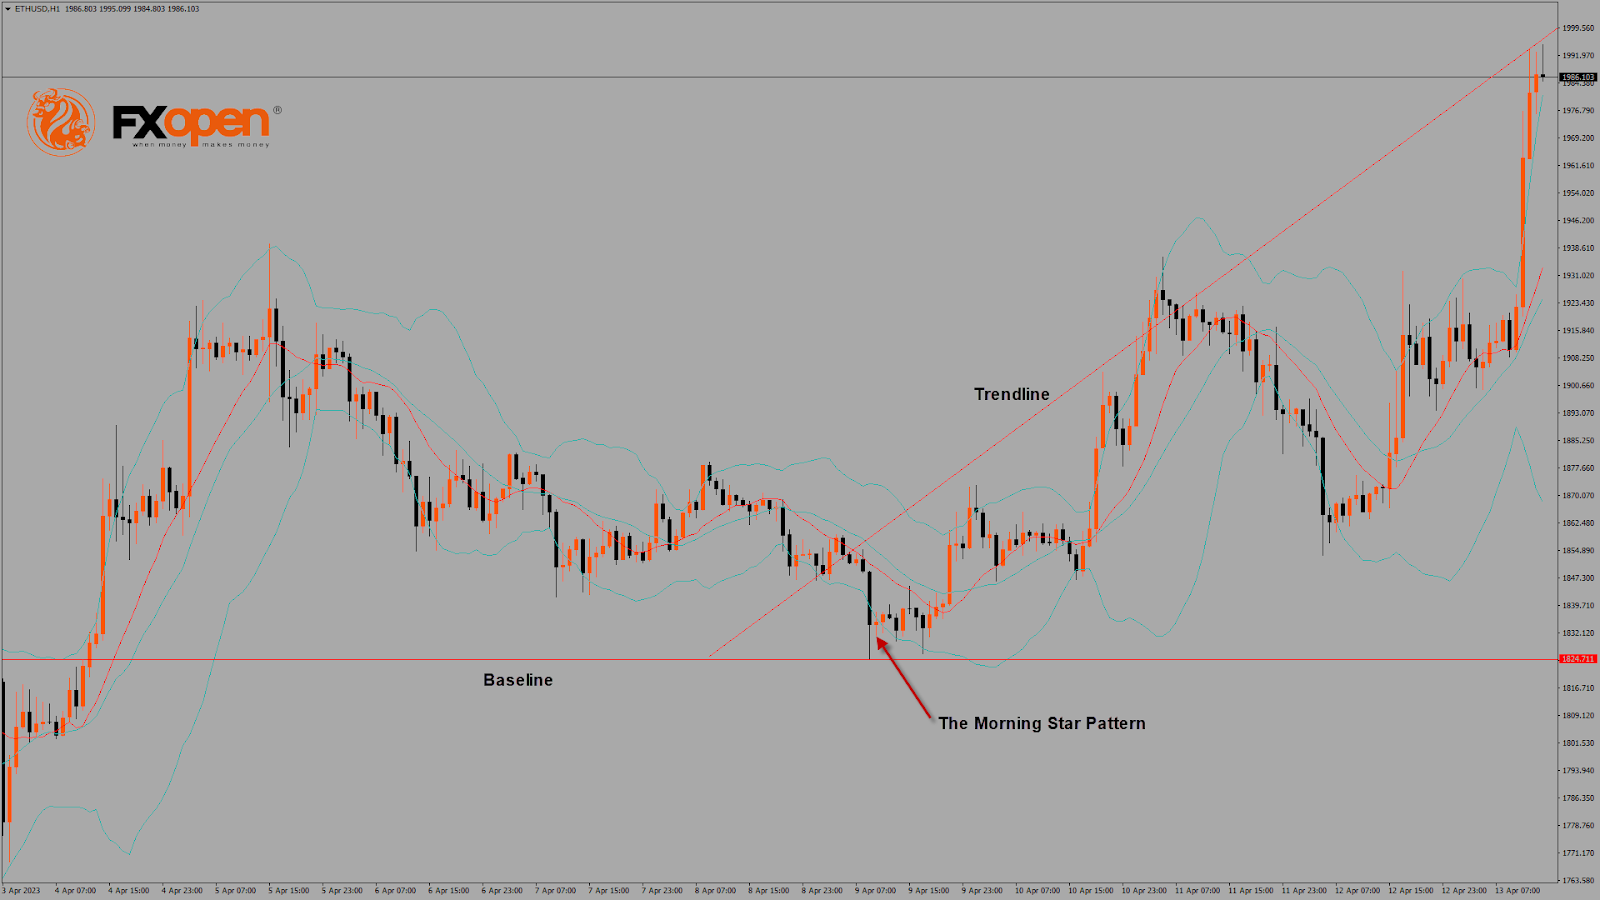
ETHUSD is now moving under a strong bullish momentum after crossing the $2,000 resistance and may touch $2,100 and $2,200 levels.
The morning star pattern is above the $1,824 handle on the H1 timeframe. It’s a bullish pattern, which signifies the end of a bearish phase.
The relative strength index is at 78.57, indicating a strong demand for Ether and a continuation of the buying pressure in the markets.
The STOCHRSI and Williams’s percent range give an overbought signal, meaning that the price is expected to decline in the short-term range.
Most of the technical indicators are bullish. Most moving averages are bullish.
ETH is now trading above the 100-hour simple and 200-hour exponential moving averages.
- Ether bullish reversal is seen above the $1,824 mark.
- The short-term range is expected to be strongly bullish.
- The average true range indicates low market volatility.
Ether Bullish Reversal Is Seen Above $1,824
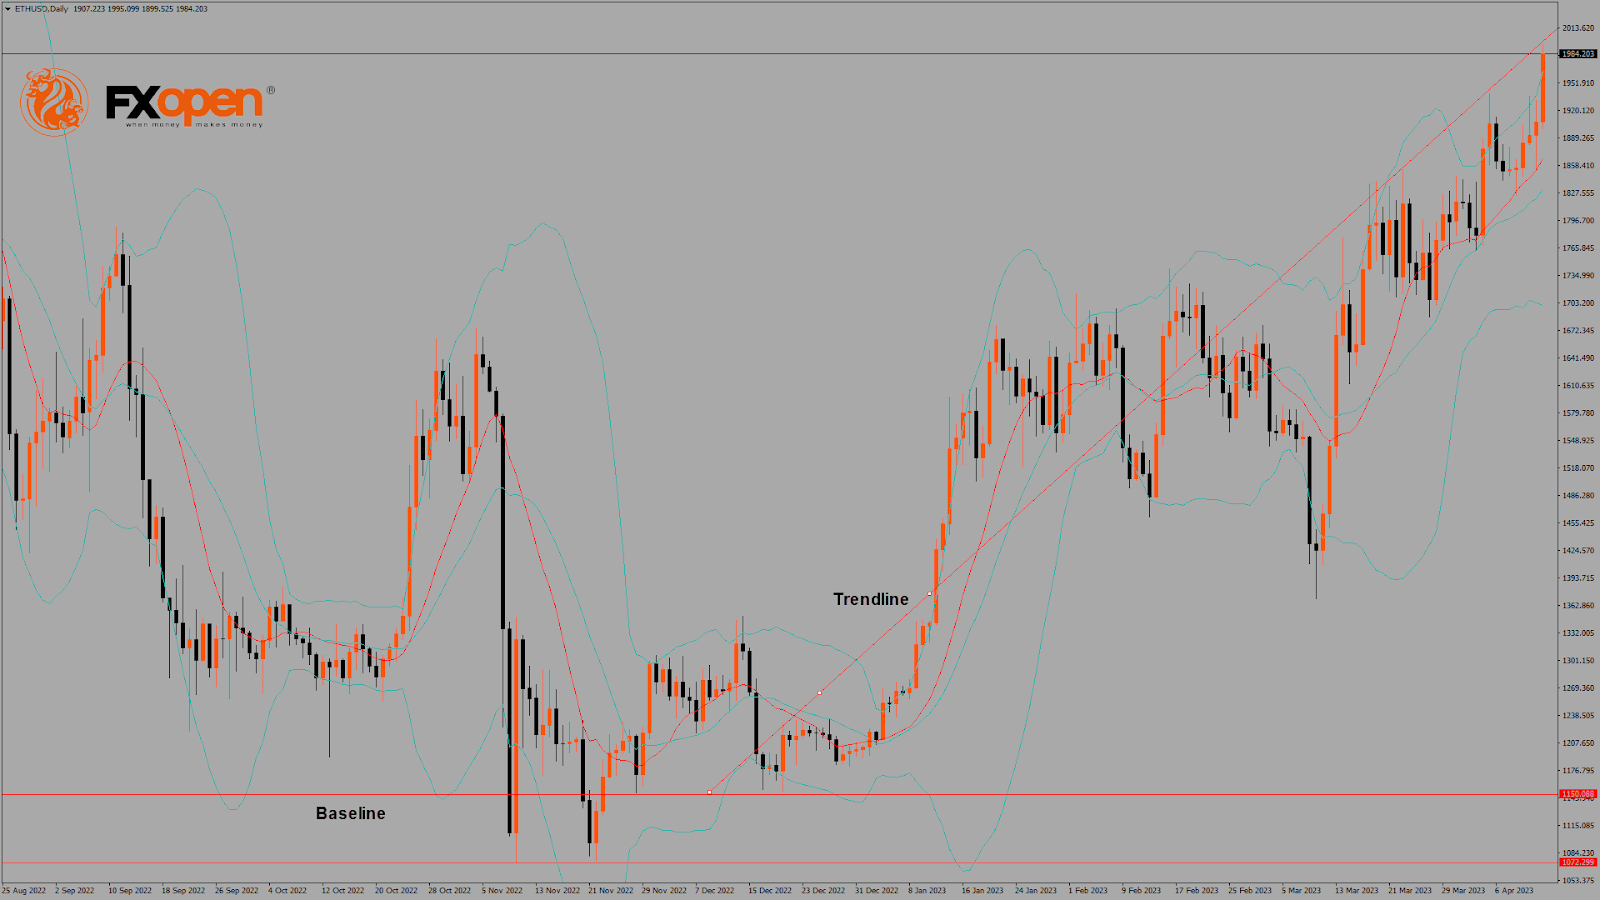
On the daily chart, ETH is trading just above its pivot level of $1,987 and is moving into a very strong bullish channel. The price has already crossed its classic resistance level of $1,991 and Fibonacci resistance level of $1,997; further upsides are located at $2,050 and $2,100.
A bullish price crossover is formed with the 20-week and 50-week adaptive moving averages in the weekly timeframe. The key support levels to watch are $1,938, which is the first resistance level of the pivot point indicator, and $1,962.
The Week Ahead
ETH has crossed the $2,000 barrier, and now we are heading towards the $2,100 level in the medium-term range in the H1 timeframe.
There is a bullish ascending channel forming from $1,824 towards the $1,999 level.
There is a major bullish trendline with the support located at $1,775, which is a 14-day RSI at 50.
The immediate short-term outlook for Ether has turned as mildly bullish, the medium-term outlook has turned bullish, and the long-term outlook for Ether is neutral in present market conditions.
The resistance zone is located at $2,024, which is a 14-day RSI at 70%, and at $2,029, which is a 50% Fib retracement from 52-week High/Low.
The weekly outlook is $2,200 with a consolidation zone of $2,100.
FXOpen offers the world's most popular cryptocurrency CFDs*, including Bitcoin and Ethereum. Floating spreads, 1:2 leverage — at your service (additional fees may apply). Open your trading account now or learn more about crypto CFD trading with FXOpen.
*Important: At FXOpen UK, Cryptocurrency trading via CFDs is only available to our Professional clients. They are not available for trading by Retail clients. To find out more information about how this may affect you, please get in touch with our team.
This article represents the opinion of the Companies operating under the FXOpen brand only. It is not to be construed as an offer, solicitation, or recommendation with respect to products and services provided by the Companies operating under the FXOpen brand, nor is it to be considered financial advice.
Stay ahead of the market!
Subscribe now to our mailing list and receive the latest market news and insights delivered directly to your inbox.


Latest articles

EUR/USD and USD/CHF Pull Back: Market Reacts to Fundamentals
European currencies have shown a recovery in recent trading sessions after their recent decline, displaying early signs of a reversal. The US dollar is weakening amid expectations surrounding upcoming US macroeconomic data, while market participants are reassessing their short-term positions

Weak Data Weigh on the Dollar: Market Awaits Trend Confirmation
The US dollar is retreating from recent highs, moving into a moderate correction after a prolonged period of gains. Pressure on the currency is building amid weaker-than-expected macroeconomic data, while market participants adopt a wait-and-see approach ahead of key labour

Market Analysis: EUR/USD Aims Recovery While USD/JPY Gives Back Recent Gains
EUR/USD is recovering losses from 1.1450. USD/JPY is correcting gains from 160.50 and might decline further below 158.00.
Important Takeaways for EUR/USD and USD/JPY Analysis Today
· The Euro struggled to stay in a