


FXOpen

EUR/USD started a major drop from the 1.1285 resistance zone. USD/JPY is currently trading above 108.00 and it is facing a lot of hurdles near the 108.30 and 108.50 levels.
Important Takeaways for EUR/USD and USD/JPY
- The Euro failed two times near the 1.1285 level, resulting in a fresh bearish wave below 1.1245.
- There was a break below a major bullish trend line with support near 1.1250 on the hourly chart of EUR/USD.
- USD/JPY declined heavily below 108.00 and later found support near the 107.80 level.
- There are two bearish trend lines forming with resistance near 108.30 and 108.50 on the hourly chart.
EUR/USD Technical Analysis
The Euro failed to continue above the 1.1285 level and formed a double top against the US Dollar. The EUR/USD pair formed a swing high near the 1.1283 and recently started a significant decline.
The pair came under a lot of pressure below 1.1250 and the 50 hourly simple moving average. There was a break below a major bullish trend line with support near 1.1250 on the hourly chart of EUR/USD.
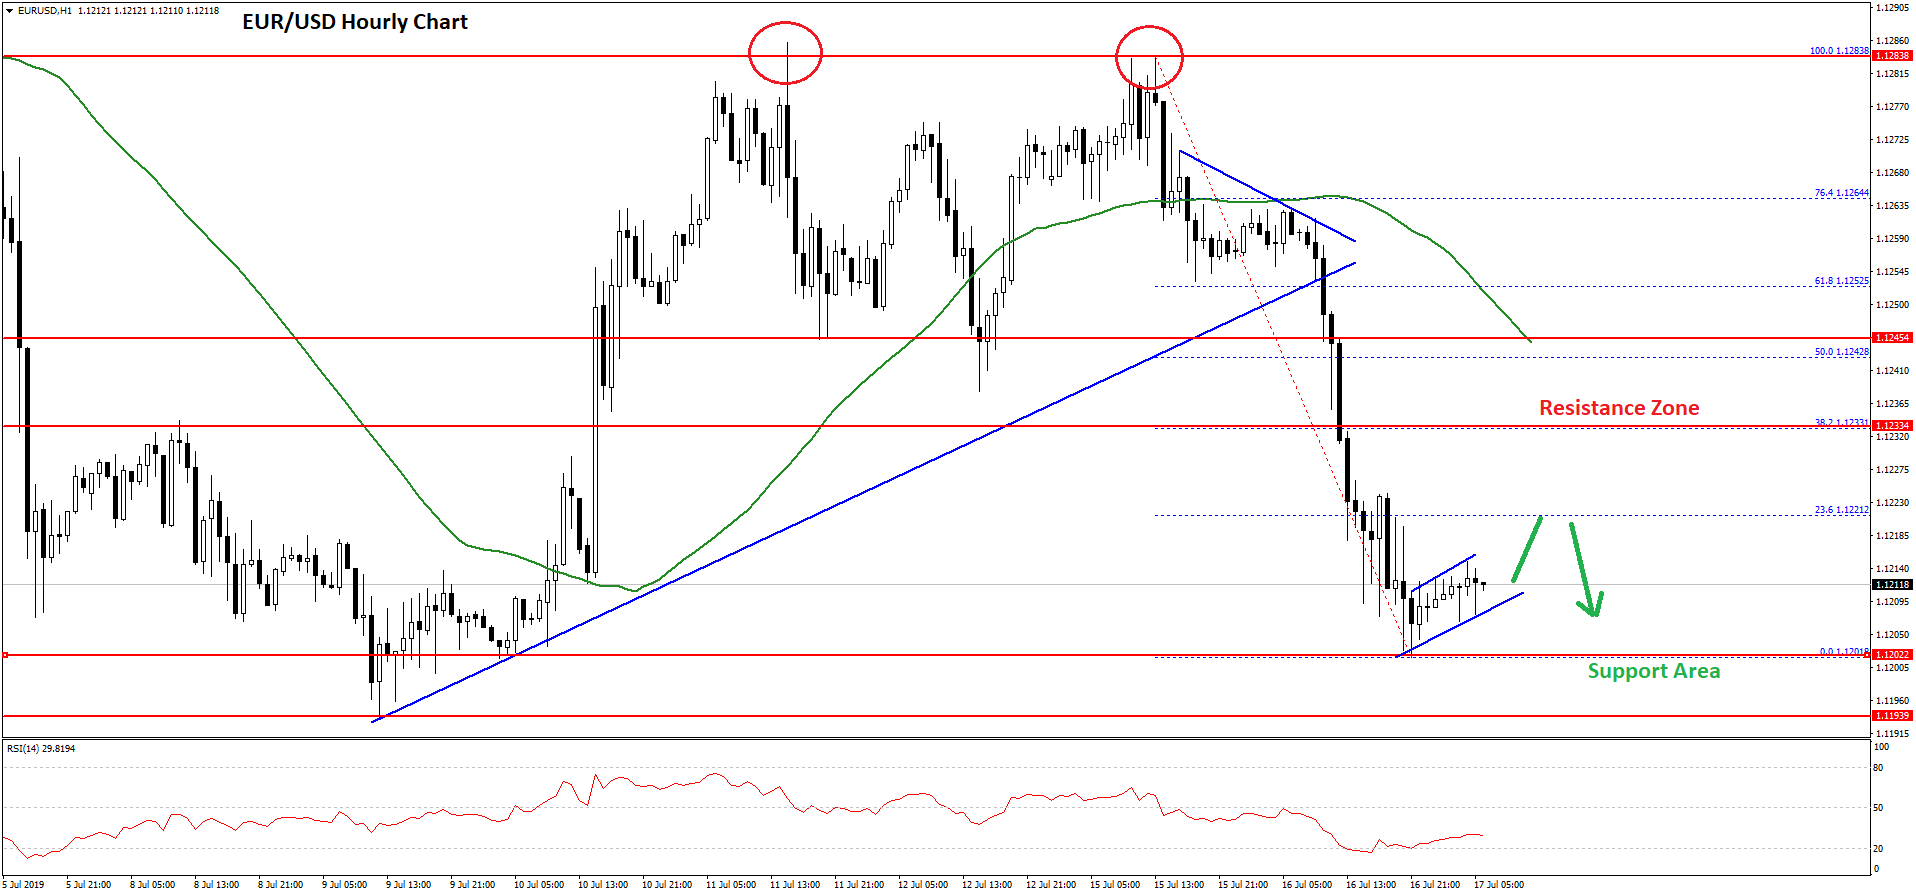
The pair even traded below the 1.1225 support level and traded close to the 1.1200 level on FXOpen. A swing low was formed near 1.1201 and recently started consolidating losses above 1.1210.
An immediate is near the 1.1200 level plus the 23.6% Fib retracement level of the recent decline from the 1.1283 high to 1.1201 low. If there is a break above the 1.1220 level, the pair could continue to rise towards the 1.1235 level.
The main resistance on the upside is near the 1.1240 level. Moreover, the 50% Fib retracement level of the recent decline from the 1.1283 high to 1.1201 low is also near the 1.1242 level to act as a strong resistance.
Conversely, if there is no upside break, EUR/USD might continue to slide below the 1.1210 level. An immediate support is near the 1.1200 level, below which there is a risk of a sharp drop towards the 1.1180 or 1.1175 level.
USD/JPY Technical Analysis
The US Dollar declined after it failed to clear the 108.60 resistance area against the Japanese Yen. The USD/JPY pair broke the 108.40 and 108.20 support levels to enter a bearish zone.
The pair even broke the 108.00 support and the 50 hourly simple moving average. A swing low was formed near 107.80 and recently the pair started an upside correction. The pair recovered above the 108.00 level and the 50 hourly simple moving average.
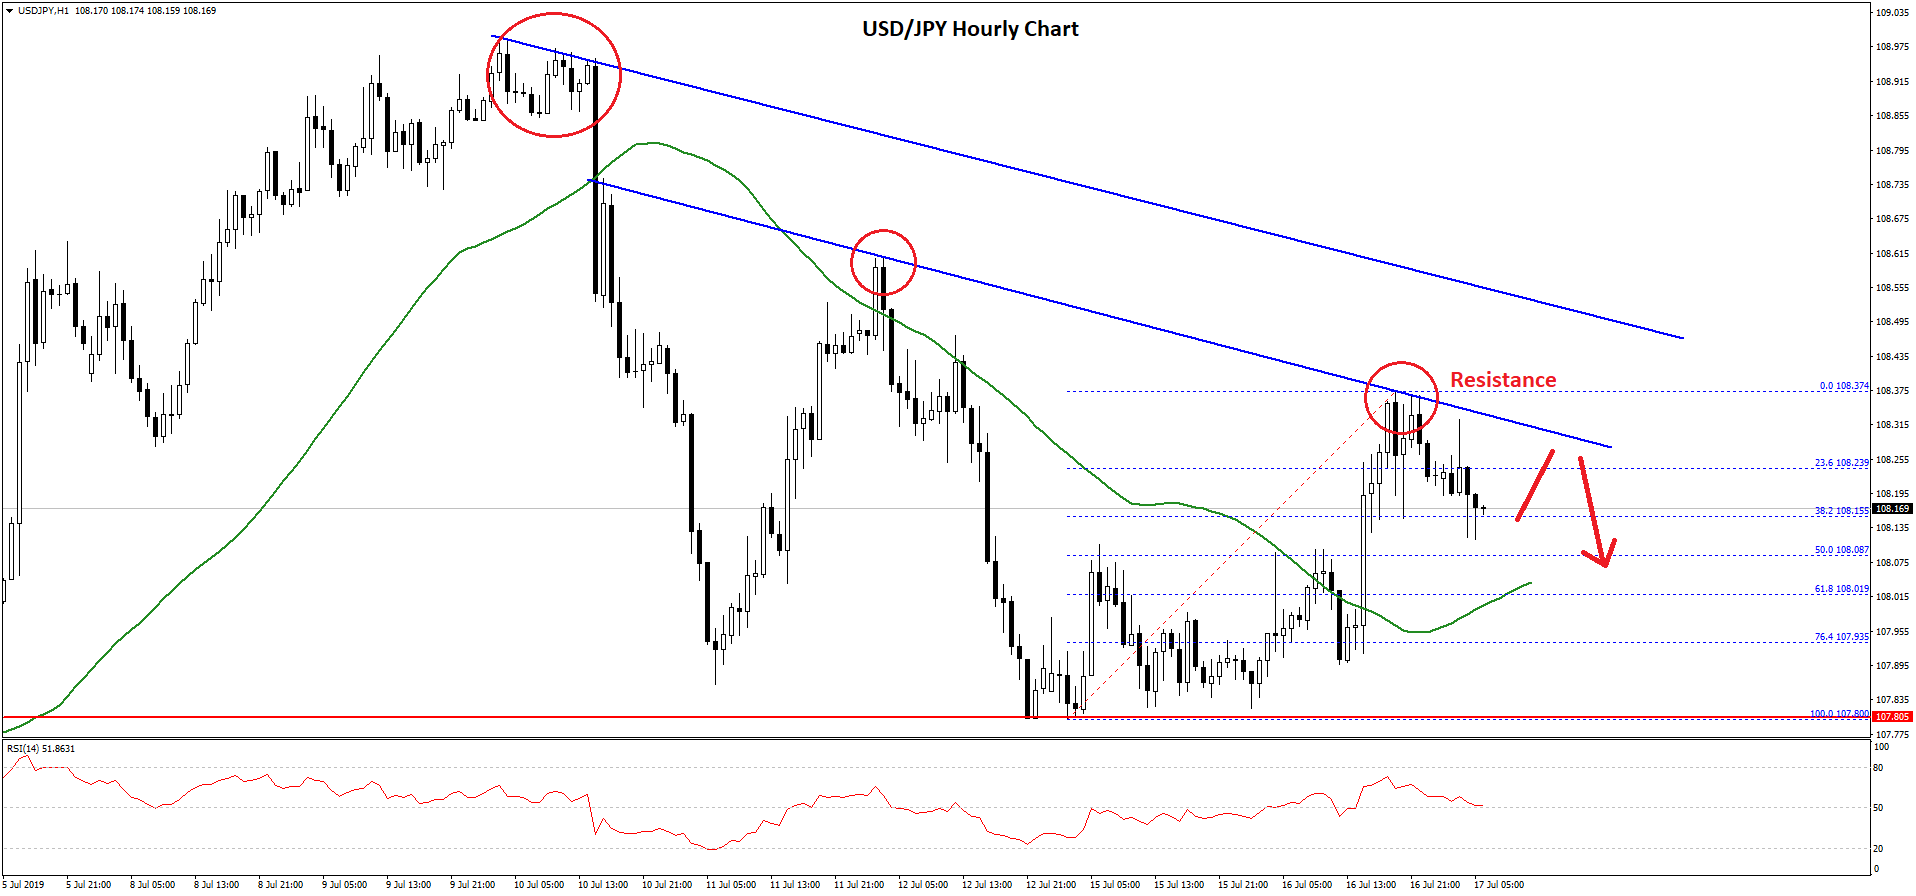
It even broke the 108.30 level and traded as high as 108.37. However, it is facing a lot of hurdles near 108.40. Moreover, there are two bearish trend lines forming with resistance near 108.30 and 108.50 on the hourly chart.
On the downside, the 108.10 level might act as a support along with the 50% Fib retracement level of the last wave from the 107.80 low to 108.37 high.
However, the main support is near the 108.00 level and the 50 hourly simple moving average. The 61.8% Fib retracement level of the last wave from the 107.80 low to 108.37 high is also near the 108.00 level.
Therefore, the pair remains well supported on the downside near the 108.10 and 108.00 levels. As long as it is trading above the 50 hourly SMA, there are chances of a break above the 108.50 level. If not, there is a risk of a fresh decline below 108.00 and 107.80 in the coming sessions.
Trade over 50 forex markets 24 hours a day with FXOpen. Take advantage of low commissions, deep liquidity, and spreads from 0.0 pips (additional fees may apply). Open your FXOpen account now or learn more about trading forex with FXOpen.
This article represents the opinion of the Companies operating under the FXOpen brand only. It is not to be construed as an offer, solicitation, or recommendation with respect to products and services provided by the Companies operating under the FXOpen brand, nor is it to be considered financial advice.
Stay ahead of the market!
Subscribe now to our mailing list and receive the latest market news and insights delivered directly to your inbox.


Latest articles

Market Insights with Gary Thomson: Where Are Oil, Gas & Global Indices Heading?
In this video, we’ll explore the key economic events and market trends, shaping the financial landscape. Get ready for insights into financial markets to help you navigate the week ahead. Let’s dive in!
In this episode of Market

Netflix (NFLX) Shares Pull Back After a 30% Surge
On 21 January, while analysing the NFLX chart, we:
→ identified a descending channel and a resistance zone around the $100 level;
→ noted that Netflix shares were showing a sustained downtrend. Selling pressure had been triggered primarily by reports of a

US Dollar Index (DXY) Rises Above the 100 Level
Today the US Dollar Index (DXY) climbed above the psychological 100 mark for the first time in 2026, supported by a tense fundamental backdrop, with the military conflict in the Middle East acting as the main driver.
→ Financial market participants