


FXOpen
EUR/USD failed to move past 1.1745 and declined sharply. USD/JPY is placed nicely in an uptrend and it could move above 112.00. The Fed interest rate decision is likely to ignite moves in both pairs today.
Important Takeaways for EUR/USD and USD/JPY
- The Euro struggled once again to clear the 1.1745 and 1.1750 resistance levels.
- EUR/USD cleared a key bullish trend line at 1.1695 on the hourly chart.
- USD/JPY is placed nicely in a bullish zone above the 111.55 support level.
- It could accelerate gains once buyers break the 112.00 barrier.
EUR/USD Technical Analysis
The Euro moved higher once again above the 1.1680 and 1.1710 resistance levels against the US Dollar. However, the EUR/USD pair faced a strong barrier near the 1.1745 and 1.1750 resistance levels.
The pair failed once again near the 1.1745 resistance and declined. It seems like the pair formed a double top pattern near the 1.1745 resistance level and it is likely to extend declines in the near term.
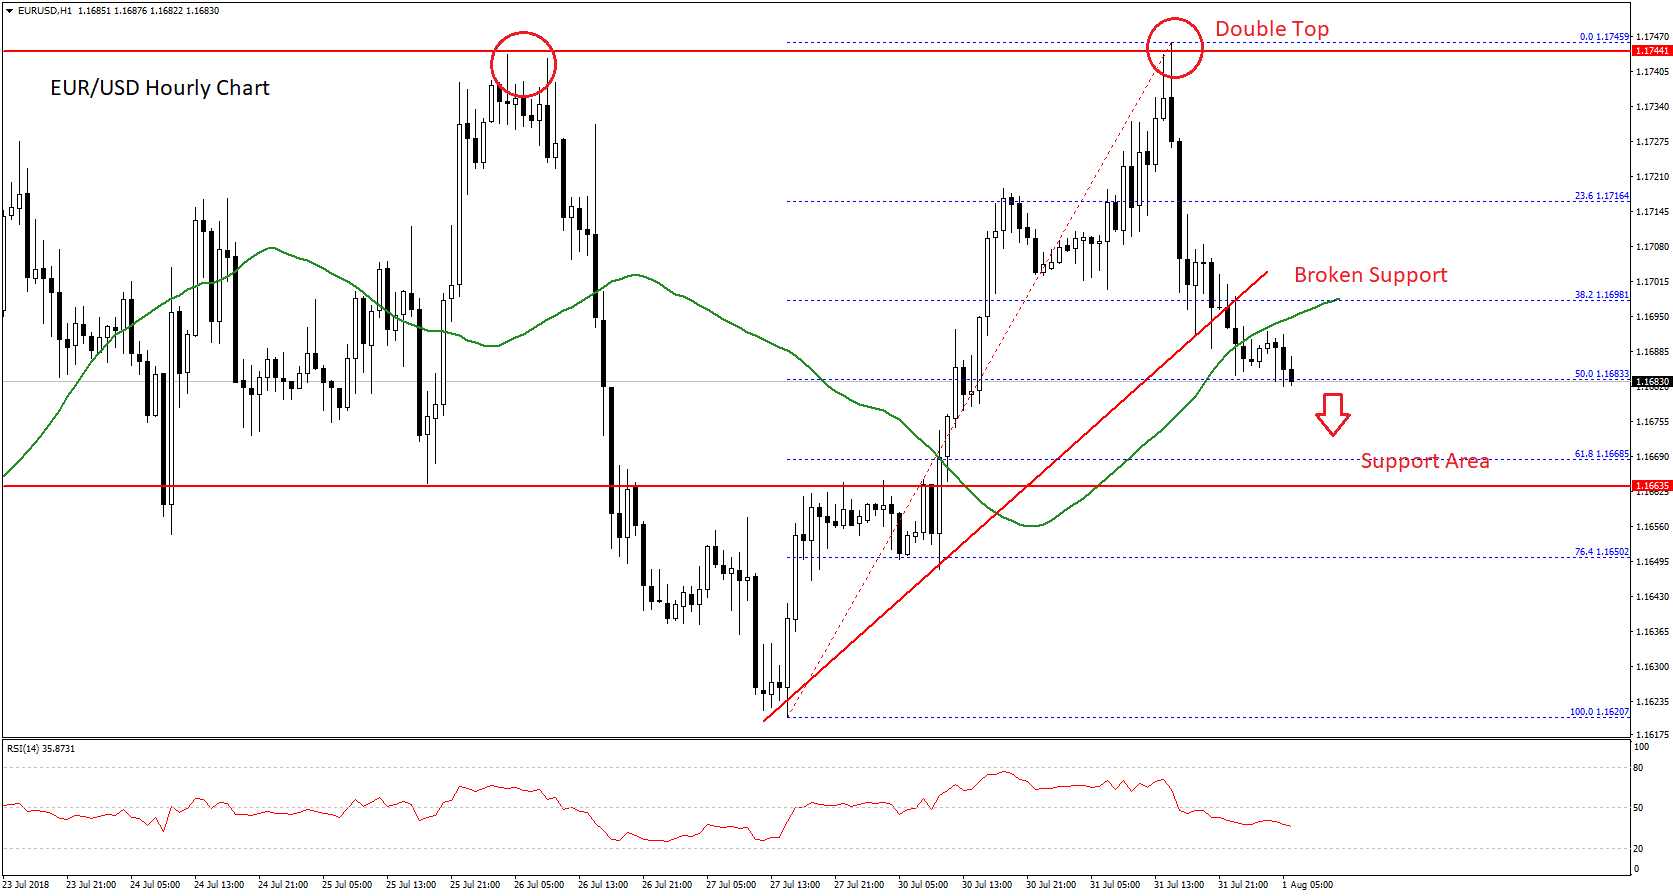
During the recent decline, the pair broke the 38.2% Fib retracement level of the last wave from the 1.1620 low to 1.1745 high. Moreover, there was a break below a key bullish trend line at 1.1695 on the hourly chart.
It opened the doors for more losses and the pair settled below the 1.1695 support and the 50 hourly simple moving average. It is currently testing the 50% Fib retracement level of the last wave from the 1.1620 low to 1.1745 high at 1.1680. Below this, the pair could accelerate declines towards the next support at 1.1660.
On the flip side, if the pair moves higher, the broken support at 1.1695 and the 50 hourly SMA are likely to prevent gains in the near term.
Today, the Euro Zone CPI Manufacturing Purchasing Managers Index (PMI) for July 2018 will be released. The market forecast is of no change from the last reading of 55.1. If the actual result misses the forecast, there could a downside push in EUR/USD.
USD/JPY Technical Analysis
The US Dollar formed a solid support base near the 110.70 and 110.80 levels against the Japanese Yen. The USD/JPY pair started an upward move and traded above the 111.00 and 111.50 resistance levels.
During the rise, the pair broke a major bearish trend line with resistance at 111.05 on the hourly chart. Later, the pair breached and settled above the 111.20 barrier and the 50 hourly simple moving average.
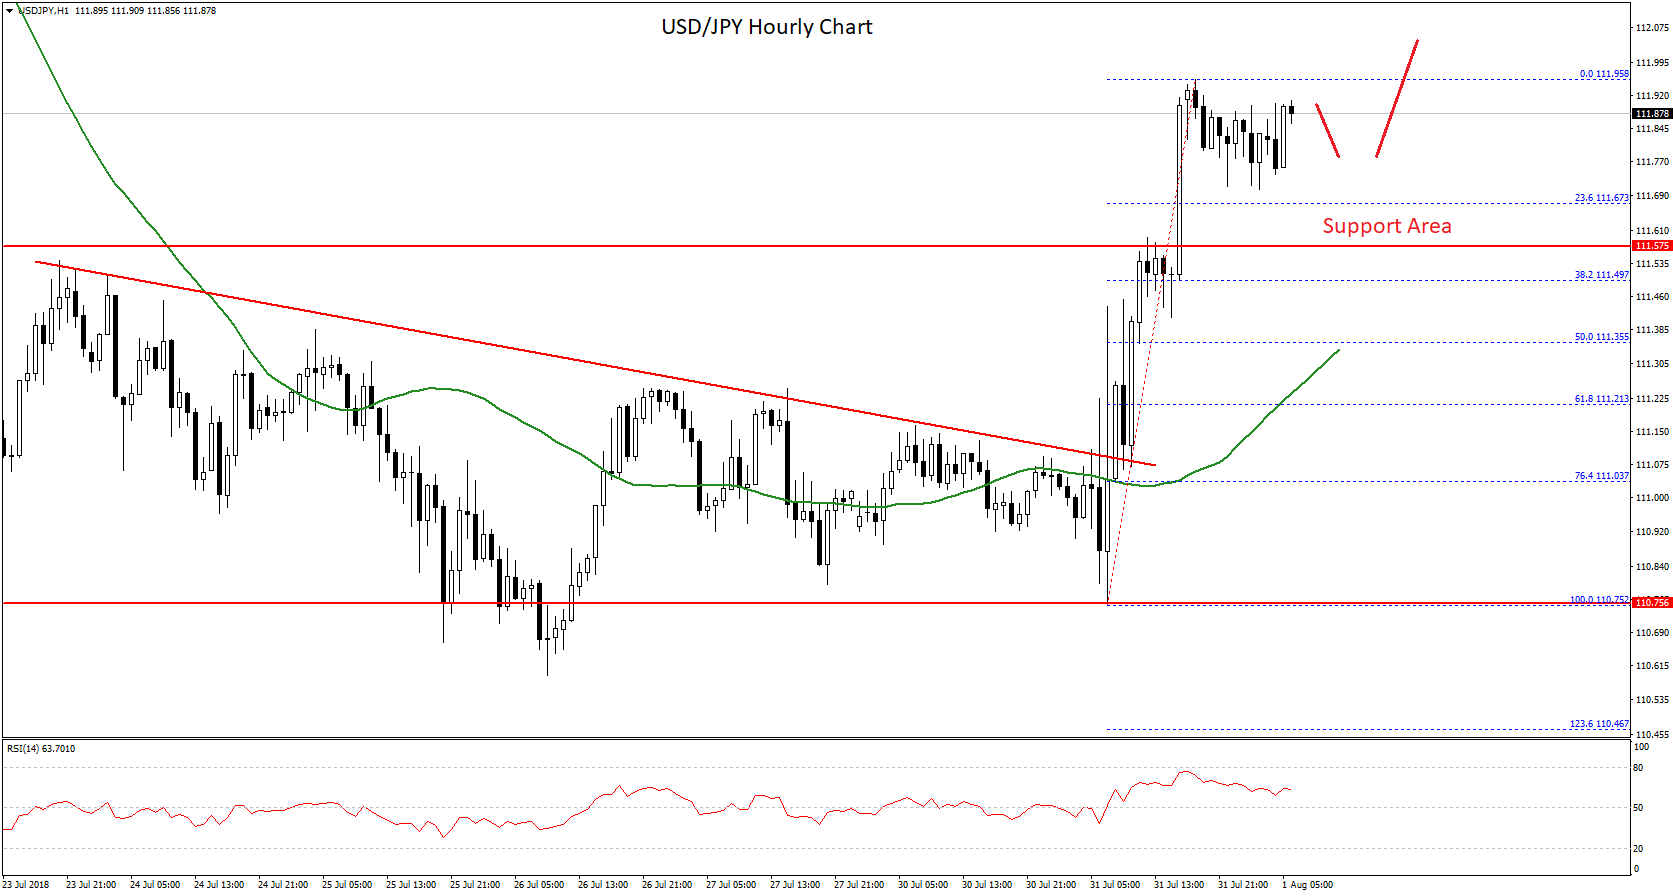
It opened the doors for upsides and the pair surged above the 111.55 and 111.60 resistance levels. A high was formed at 111.95 and the pair is currently consolidating gains. On the downside, an initial support is near the 23.6% Fib retracement level of the last wave from the 110.75 low to 111.95 high.
Below the 111.65 support, the pair is likely to find bids near the 111.57 level, which was a resistance earlier. Therefore, if the pair corrects lower, it may perhaps find supports near 111.65 and 111.57.
On the upside, the recent high and 112.00 are immediate hurdles for buyers. A successful close above 112.00 could clear the path for more upsides towards the 112.40 and 112.50 levels.
Today’s Fed interest rate decision is the main risk event during the US session, and it may perhaps create swing moves in both EUR/USD and USD/JPY.
Trade over 50 forex markets 24 hours a day with FXOpen. Take advantage of low commissions, deep liquidity, and spreads from 0.0 pips (additional fees may apply). Open your FXOpen account now or learn more about trading forex with FXOpen.
This article represents the opinion of the Companies operating under the FXOpen brand only. It is not to be construed as an offer, solicitation, or recommendation with respect to products and services provided by the Companies operating under the FXOpen brand, nor is it to be considered financial advice.
Stay ahead of the market!
Subscribe now to our mailing list and receive the latest market news and insights delivered directly to your inbox.


Latest articles

Market Insights with Gary Thomson: Where Are Oil, Gas & Global Indices Heading?
In this video, we’ll explore the key economic events and market trends, shaping the financial landscape. Get ready for insights into financial markets to help you navigate the week ahead. Let’s dive in!
In this episode of Market

Netflix (NFLX) Shares Pull Back After a 30% Surge
On 21 January, while analysing the NFLX chart, we:
→ identified a descending channel and a resistance zone around the $100 level;
→ noted that Netflix shares were showing a sustained downtrend. Selling pressure had been triggered primarily by reports of a

US Dollar Index (DXY) Rises Above the 100 Level
Today the US Dollar Index (DXY) climbed above the psychological 100 mark for the first time in 2026, supported by a tense fundamental backdrop, with the military conflict in the Middle East acting as the main driver.
→ Financial market participants