


EUR/USD Faces Hurdles, USD/CHF Could Extend Decline
FXOpen

EUR/USD started a fresh decline below the 1.1800 support zone. USD/CHF is declining and it might continue lower below the 0.9220 zone.
Important Takeaways for EUR/USD and USD/CHF
· The Euro started a fresh decline below the 1.1800 and 1.1750 support levels against the US Dollar.
· There is a major bearish trend line forming with resistance near 1.1735 on the hourly chart of EUR/USD.
· USD/CHF failed to clear 0.9335 and started a fresh downward move.
· There was a break below a key bullish trend line with support near 0.9290 on the hourly chart.
EUR/USD Technical Analysis
The Euro struggled to continue higher above the 1.1840 resistance zone against the US Dollar. As a result, the EUR/USD pair started a fresh decline below the 1.1800 support zone.
The pair traded below the 1.1750 support level and settled above the 50 hourly simple moving average. There was also a break below the 1.1720 level. A low was formed near 1.1700 on FXOpen before the pair started an upside correction.
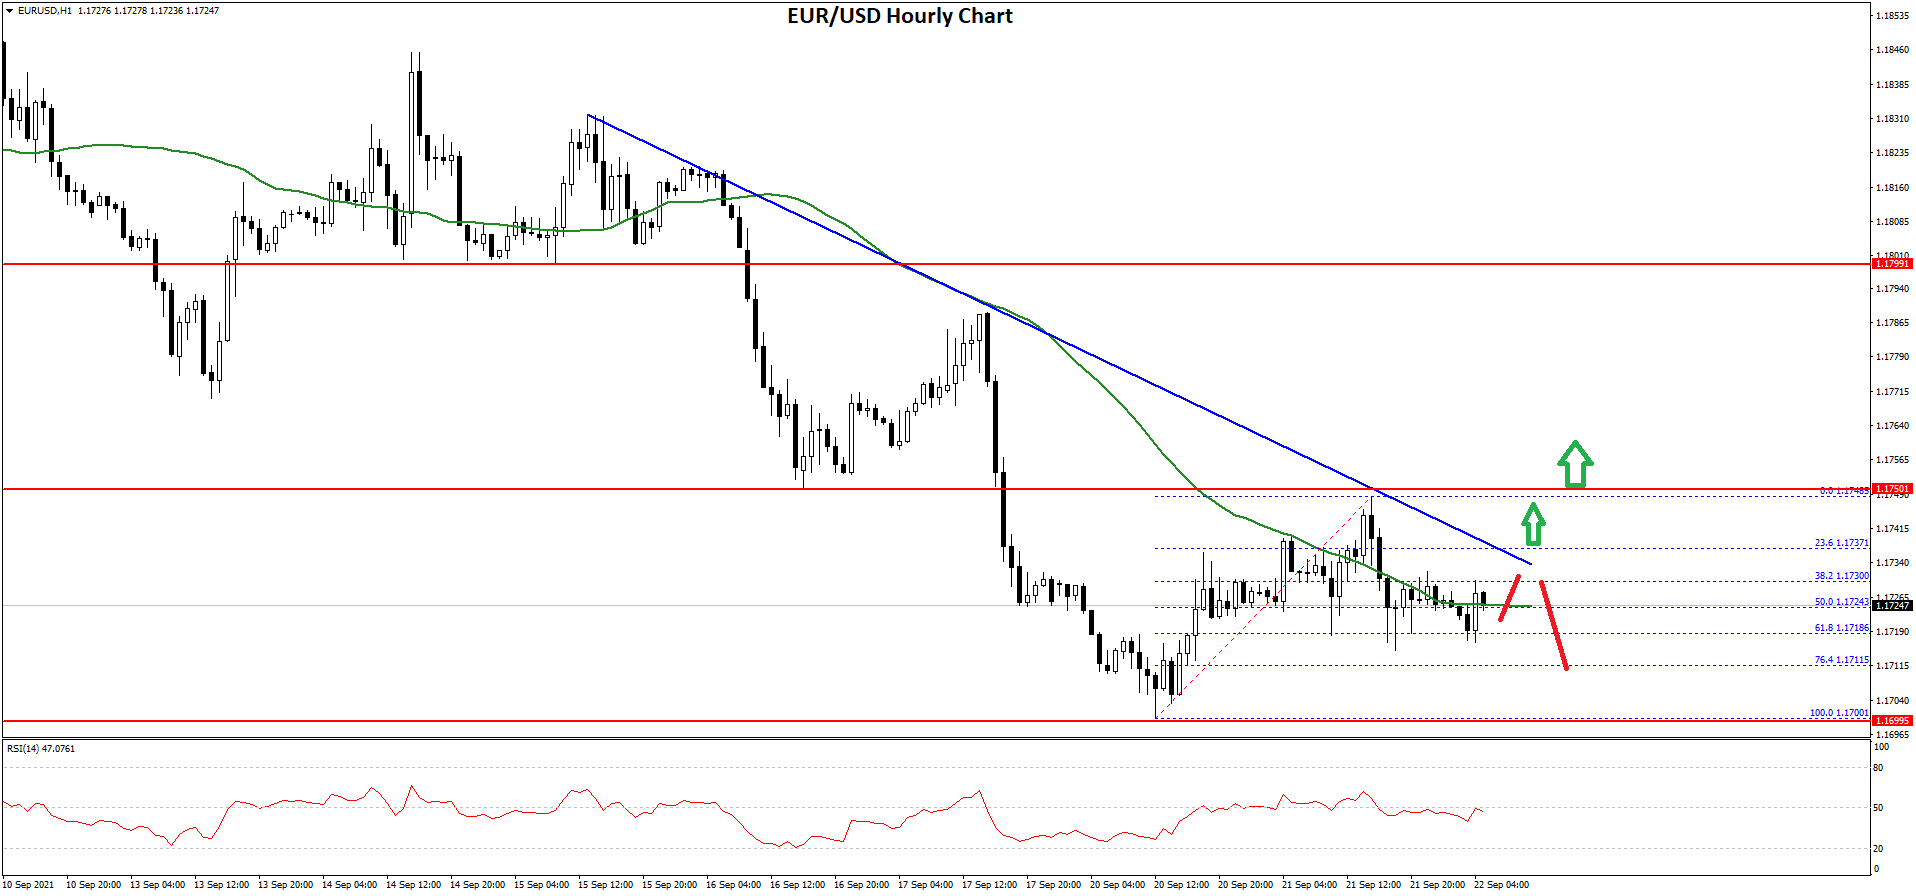
The pair recovered above the 1.1720 level, but it failed near 1.1750. A high is formed near 1.1748 and the pair is now moving lower.
There was a break below the 50% Fib retracement level of the upward move from the 1.1701 swing low to 1.1748 high. It is now consolidating near the 1.1720 level and the 50 hourly simple moving average. An immediate support is near the 1.1718 level.
It is near the 61.8% Fib retracement level of the upward move from the 1.1701 swing low to 1.1748 high. The next major support is near the 1.1700 level. A downside break below the 1.1700 support could start another decline.
On the upside, an initial resistance is near the 1.1735 level. There is also a major bearish trend line forming with resistance near 1.1735 on the hourly chart of EUR/USD.
The main resistance is near 1.1750. If there is an upside break above the 1.1750 resistance zone, the price could rise steadily towards the 1.1800 resistance zone.
USD/CHF Technical Analysis
The US Dollar climbed above the 0.9300 level against the Swiss franc, but it failed to continue higher. The USD/CHF pair traded as high as 0.9332 before it started a fresh decline.
There was a break below the 0.9300 support and the 50 hourly simple moving average. It cleared the 50% Fib retracement level of the upward move from the 0.9163 swing low to 0.9332 high.
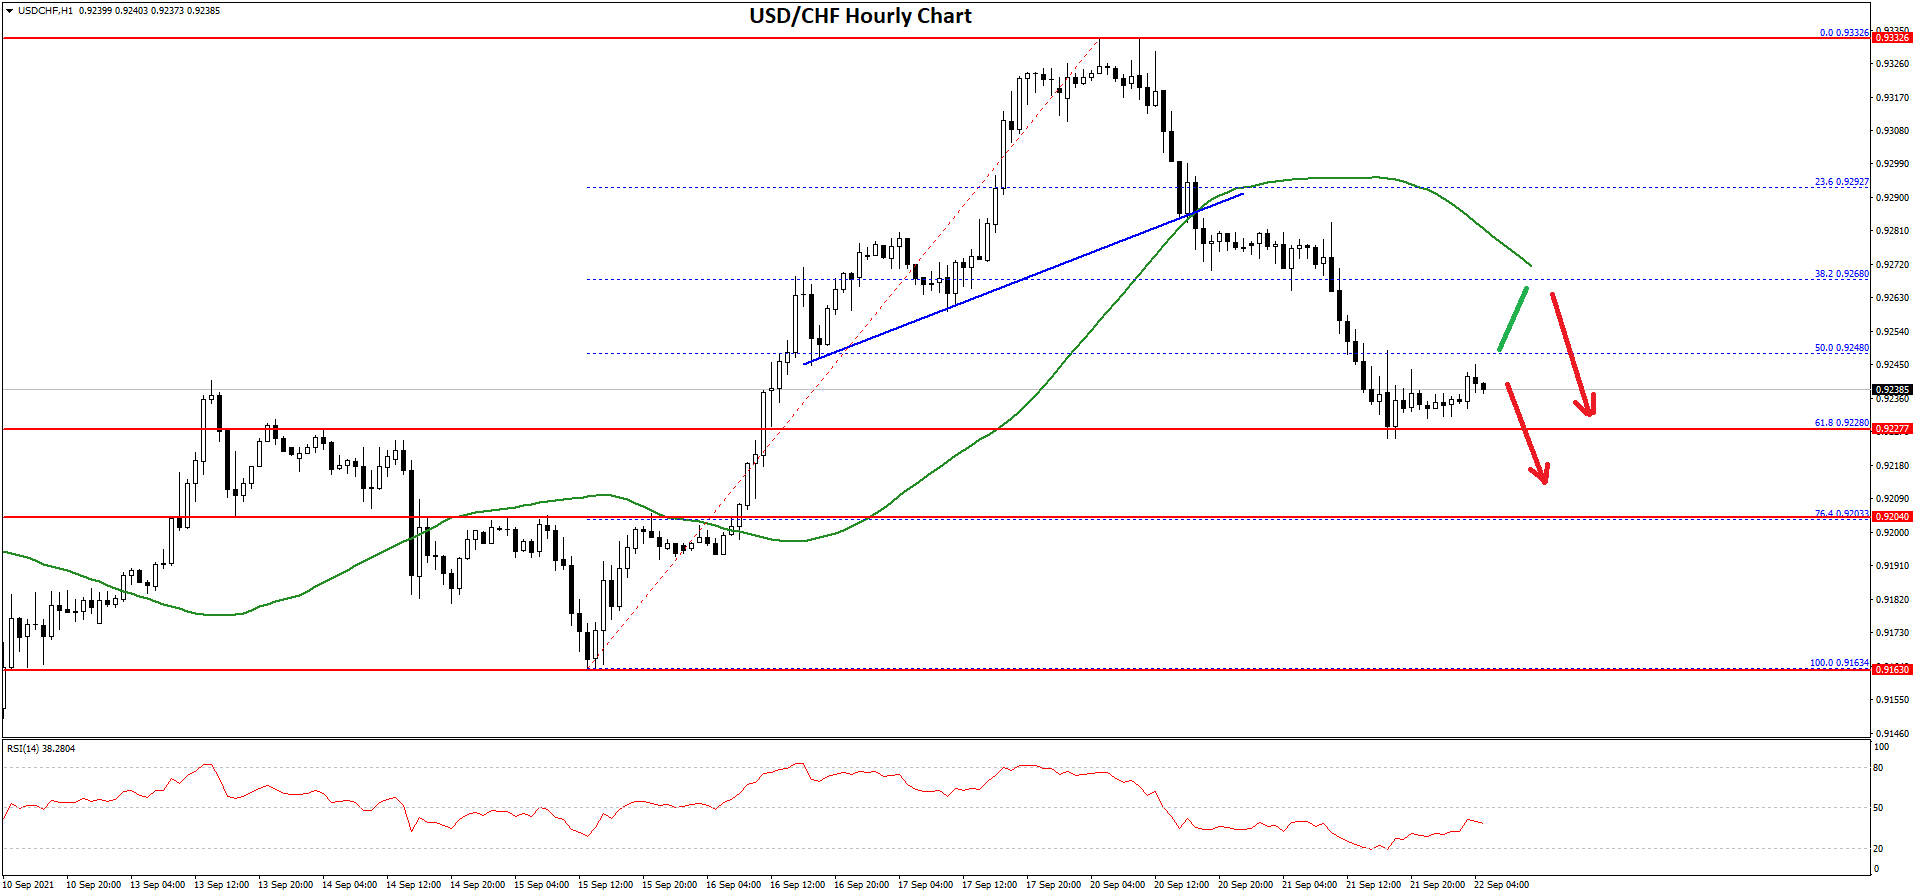
Besides, there was a break below a key bullish trend line with support near 0.9290 on the hourly chart. The pair is now finding bids near the 0.9225 support zone. The 61.8% Fib retracement level of the upward move from the 0.9163 swing low to 0.9332 high is also providing support.
On the downside, the pair might find bids near the 0.9225 level. The main support is now forming near the 0.9200 level, below which the pair could dive towards 0.9150.
An initial resistance is near the 0.9250 level. The first key resistance is near the 0.9270 level and the 50 hourly SMA. If there is a clear break above the 0.9270 resistance zone, the pair could start a steady increase. The next major resistance is near the 0.9335.
This forecast represents FXOpen Markets Limited opinion only, it should not be construed as an offer, invitation or recommendation in respect to FXOpen Markets Limited products and services or as financial advice.
This article represents the opinion of the Companies operating under the FXOpen brand only. It is not to be construed as an offer, solicitation, or recommendation with respect to products and services provided by the Companies operating under the FXOpen brand, nor is it to be considered financial advice.
Stay ahead of the market!
Subscribe now to our mailing list and receive the latest market news and insights delivered directly to your inbox.

Latest articles

US Dollar Strengthens Amid Equity Market Weakness and Hawkish Fed Rhetoric
The US dollar continues to hold firm near multi-year highs as sentiment across equity markets deteriorates and investors increasingly expect the Federal Reserve to maintain a restrictive monetary policy stance for longer. The US economy remains resilient, while inflation risks

Bitcoin: Corrective Channel Broken as Traders Turn More Active
Bitcoin has come under the influence of several factors simultaneously. The wave of selling at the beginning of June was linked to Strategy's first disclosed Bitcoin sale in several years, a prolonged series of outflows from spot ETFs, and a

DAX 40: consolidation amid technology sell-off
A wave of selling in the technology sector that emerged earlier this week has weighed on European equities. The trigger was investor concern over the profitability of large-scale debt-funded investments by major US tech companies in AI infrastructure. The Nasdaq