


EUR/USD Remains Bullish While USD/JPY Accelerates Decline
FXOpen
EUR/USD traded higher recently and broke the 1.1425 resistance zone. USD/JPY remained in a downtrend and it may continue to decline towards the 109.00 level.
Important Takeaways for EUR/USD and USD/JPY
- The Euro climbed higher recently and broke the 1.1425 resistance area.
- There is a key bullish trend line formed with support at 1.1440 on the hourly chart of EUR/USD.
- USD/JPY is under a lot of pressure and it may decline further towards 109.00.
- There is a major bearish trend line formed with resistance at 110.20 on the hourly chart.
EUR/USD Technical Analysis
The Euro started a decent upward move from the 1.1340 support level against the US Dollar. The EUR/USD pair traded higher and broke the 1.1380 and 1.1425 resistance levels.
There was even a close above the 1.1400 pivot level on FXOpen. The pair traded towards the 1.1475 level and settled above the 50 hourly simple moving average. The last swing high was near 1.1475 and later the pair corrected lower below 1.1450.
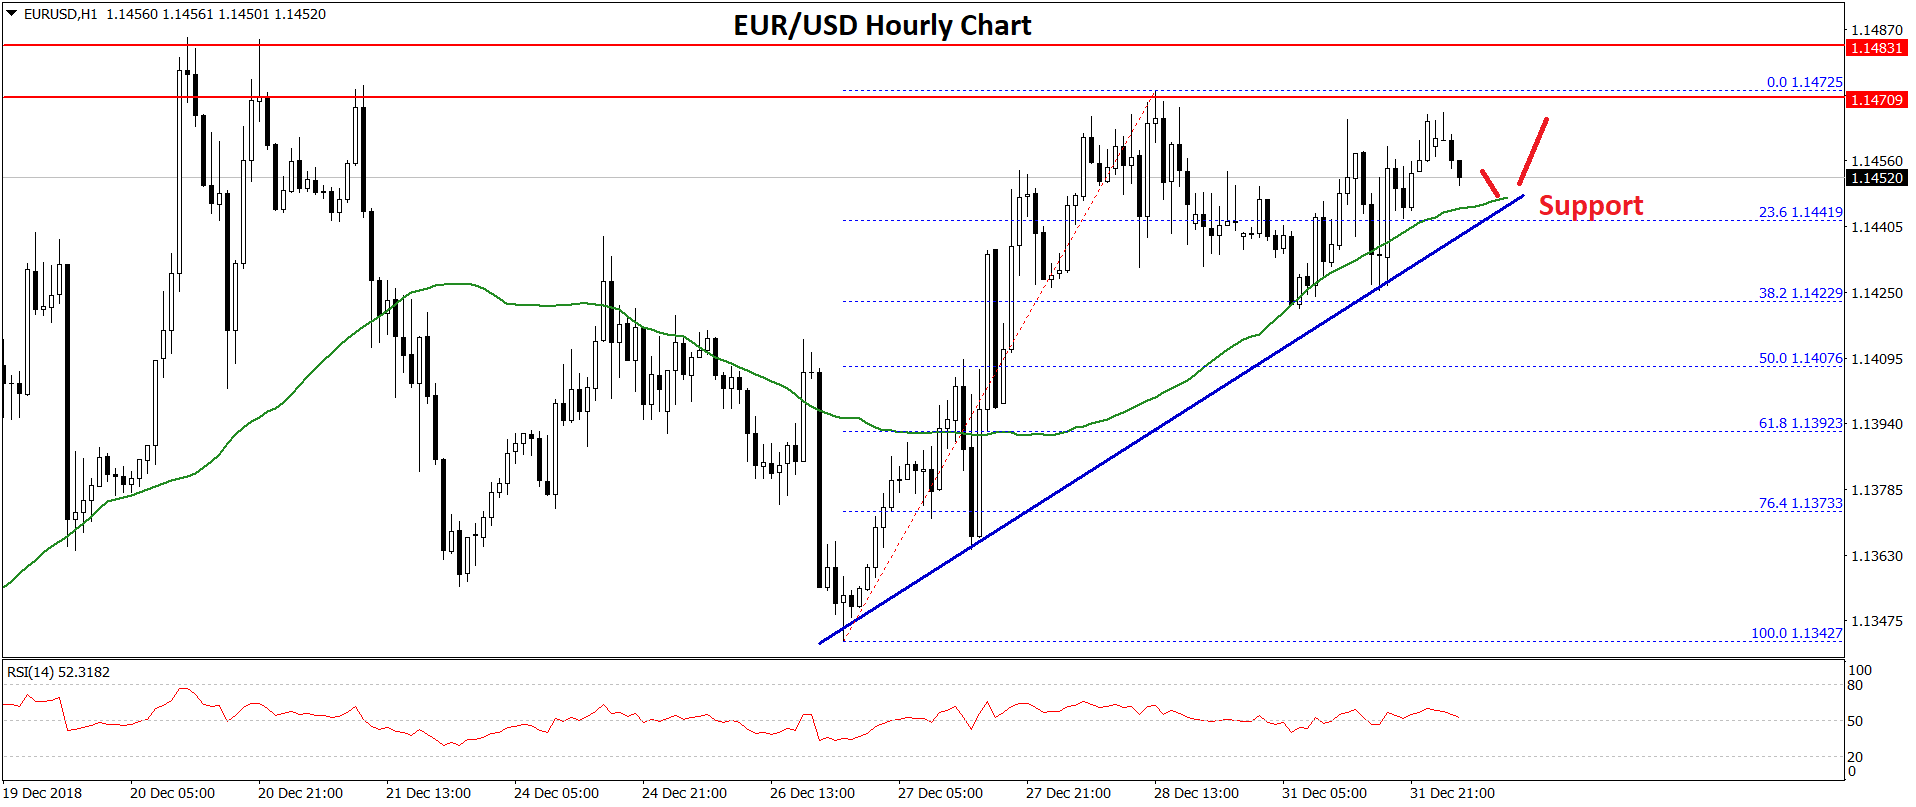
The pair even traded below the 23.6% Fib retracement level of the last wave from the 1.1342 low to 1.1472 high. However, the decline was protected near the 1.1422 level.
More importantly, there is a key bullish trend line formed with support at 1.1440 on the hourly chart of EUR/USD. The 38.2% Fib retracement level of the last wave from the 1.1342 low to 1.1472 high also acted as a solid support.
If the pair continues to move down, there could be a downside break below the 1.1400 support. The next support is at 1.1380 followed by 1.1350.
On the upside, the pair must break the 1.1475 and 1.1495 resistance levels to start a fresh bullish wave. A clear break above the 1.1500 resistance may well open the doors for a solid upward move towards the 1.1550 level in the near term.
USD/JPY Technical Analysis
The US Dollar remained in a significant downtrend from the 113.00 swing high against the Japanese Yen. The USD/JPY pair declined below the 112.50 and 111.60 support levels to move into a bearish zone.
Recently, the pair broke the 110.20 and 110.00 support levels to accelerate the decline. Sellers even pushed the pair below the 1.236 Fib extension level of the last wave from the 110.13 low to 111.40 high.
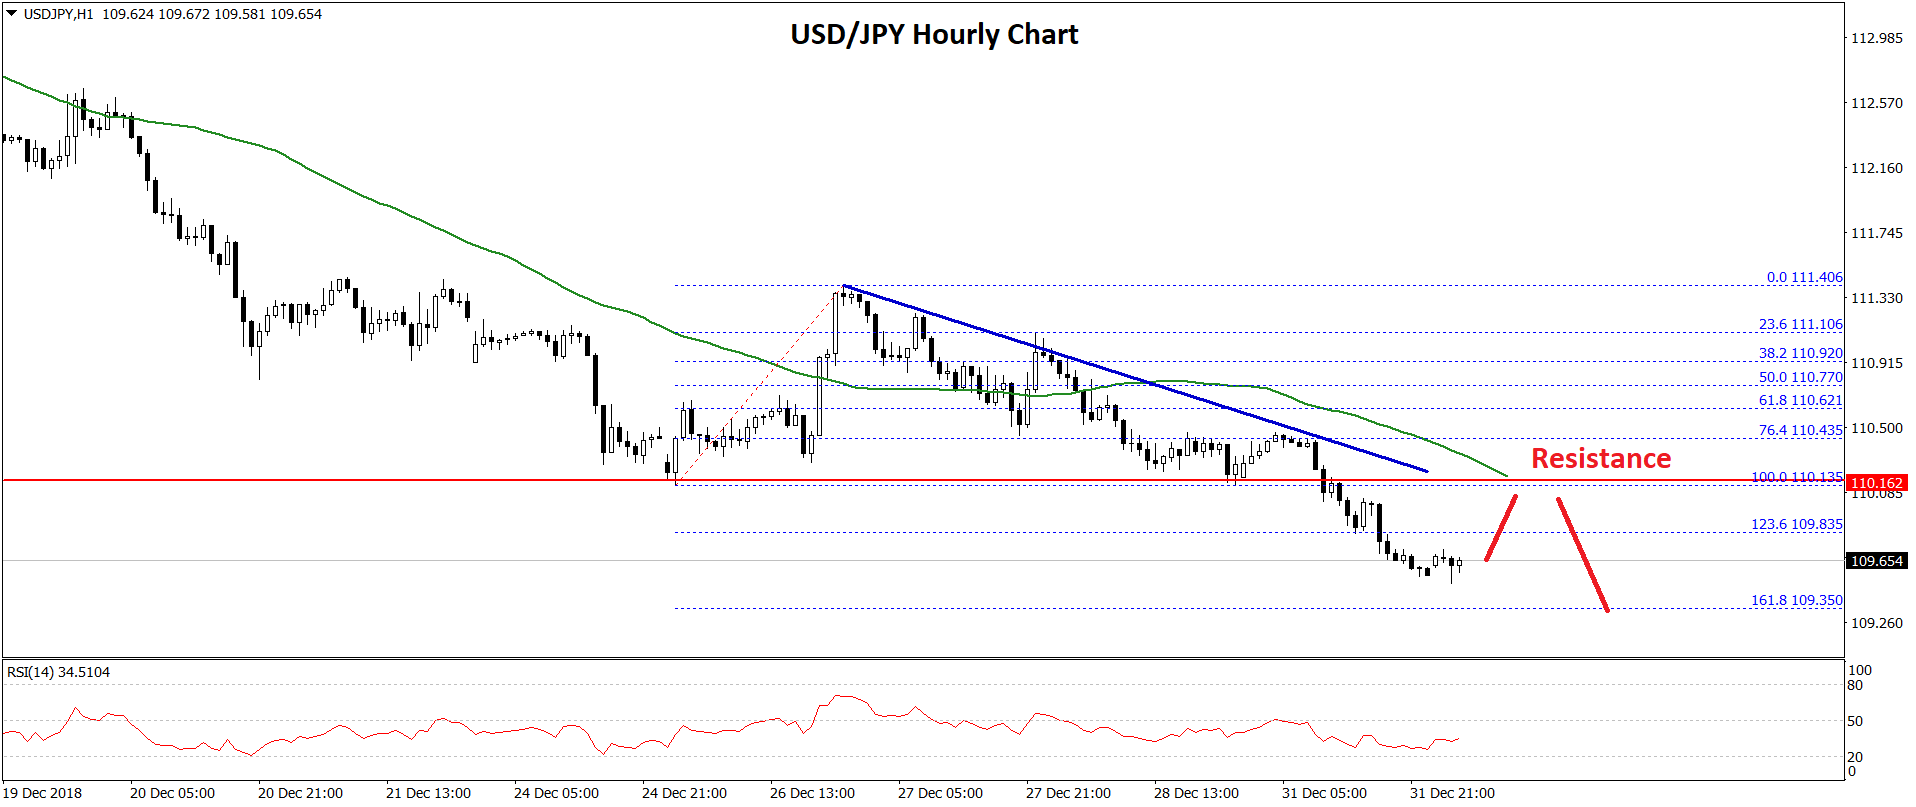
If the pair continues to move down below 109.30 and the 1.618 Fib extension level of the last wave from the 110.13 low to 111.40 high, then the pair may test the 109.00 support area in the near term.
On the upside, there is a strong resistance formed near the 110.15 level. There is also a major bearish trend line formed with resistance at 110.20 on the hourly chart.
Moreover, the 50 hourly simple moving average is also positioned near the 110.20 level. Therefore, a break above the trend line and 110.15 is needed for more gains in the near term.
Overall, the pair is positioned for more losses towards the 109.00 level as long as USD/JPY is placed below the 110.20 resistance level.
Trade over 50 forex markets 24 hours a day with FXOpen. Take advantage of low commissions, deep liquidity, and spreads from 0.0 pips (additional fees may apply). Open your FXOpen account now or learn more about trading forex with FXOpen.
This article represents the opinion of the Companies operating under the FXOpen brand only. It is not to be construed as an offer, solicitation, or recommendation with respect to products and services provided by the Companies operating under the FXOpen brand, nor is it to be considered financial advice.
Stay ahead of the market!
Subscribe now to our mailing list and receive the latest market news and insights delivered directly to your inbox.


Latest articles

DAX 40: consolidation amid technology sell-off
A wave of selling in the technology sector that emerged earlier this week has weighed on European equities. The trigger was investor concern over the profitability of large-scale debt-funded investments by major US tech companies in AI infrastructure. The Nasdaq

Euro Hits Fresh Yearly Lows Amid Dovish ECB Signals
The euro remains under pressure following weak macroeconomic data from the euro area and fresh signals that the European Central Bank is prepared to maintain a more accommodative monetary policy stance. Data released yesterday pointed to a deterioration in business

Pound at Key Levels: Markets Assess Impact of Political Uncertainty in the UK
The British pound remains under pressure following increased political uncertainty in the United Kingdom triggered by the Prime Minister’s resignation. Investors are assessing potential shifts in the political and economic policy outlook after the head of government stepped down,