


Euro 'shredded'? - EUR/USD, USD/JPY, NZD/USD outlook.
FXOpen

General view: Last week soft employment data caused NZD to drop but main focus was the European Central Bank statement and press conference on which ECB president, Mario Draghi, pointed that there is good chance of ECB announcing monetary easing program after its June meeting. EUR/USD dropped 250 pips from its peak right below 1.4000. We are starting this week while trader’s need to adjust their engagement to the new, speculative, situation of rising chances that ECB will ease financial conditions even more.
EUR/USD – A fallen angel
This is rare thing to see – a weekly outside bar. After attacking 1.4000 level for just couple of minutes, pair dropped 250 pips to 1.3750 and previous week ended almost where it dropped (1.3760) what proves weakness of the demand side. EUR/USD have beaten both high and low of the previous week (28th Apr – 2 May) forming a bearish weakly outside bar – strong reversal signal.
Looking at other analysis I found out that many people are looking for long positions from current levels, therefore we might see retracement to one of many strong resistance levels:
1.3780 – today’s Pivot Point, week before low.
1.3815 – local low, significant support level from last couple weeks, today’s Pivot R1
1.3830 – small corrective structure, Exponential Moving Averages channel, Fibonacci retracement 38.2% of the last week.
To look for support levels we need to switch timeframe to daily, and there we can find:
1.3730/20 – today Pivot S1
1.3700 – round level, March/April low, near Pivot S2
1.3640 – February local low, near Pivot S3
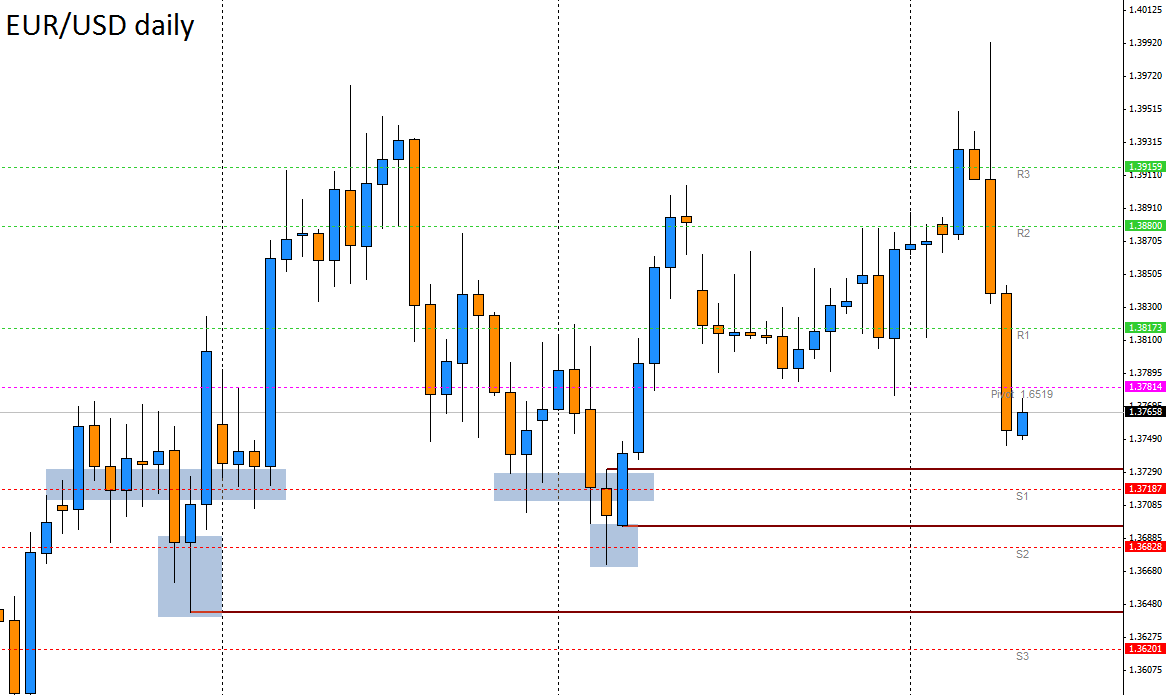
EUR/USD D1, click to enlarge.
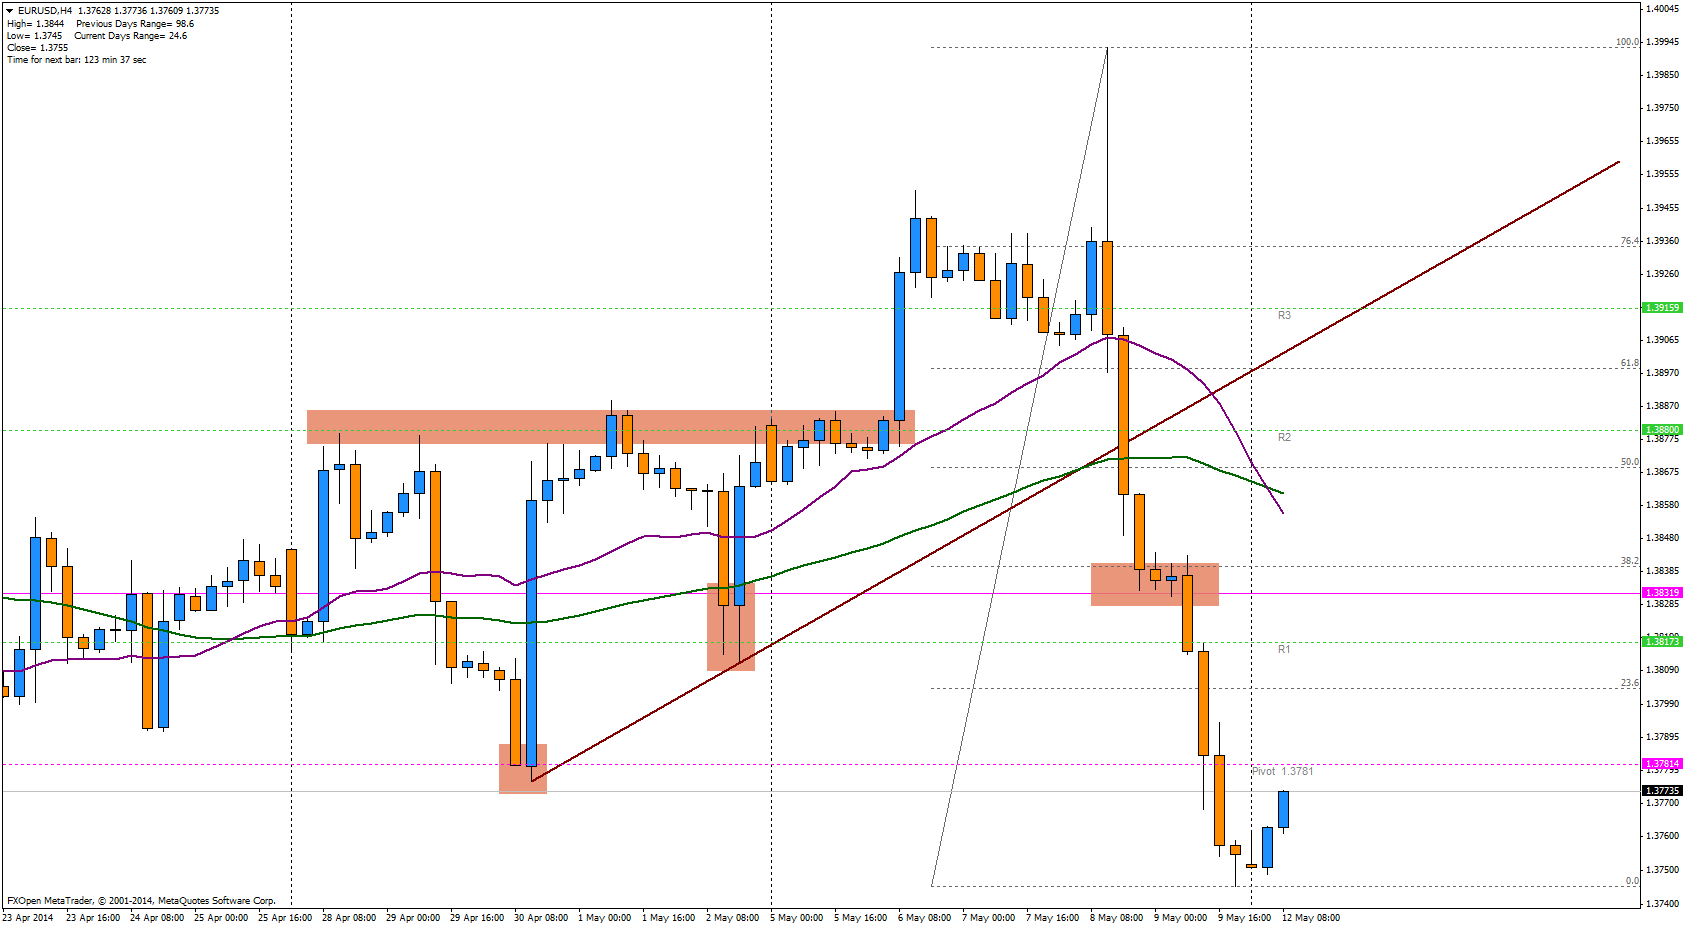
EUR/USD H4, click to enlarge.
This week’s macro data are important both for EUR and USD.
EMU publish significant data on Tuesday – ZEW sentiment indicator, Wednesday – industrial production and Thursday – CPI & GDP. These may fuel downside pressure on EUR as well as calm down the mess caused by Draghi during press conference last week. ZEW and Industrial Production are main risk as analysts project soft readings, but also final estimate of CPI may be disappointing.
Data incoming from US contains retail sales (Tuesday),Producer Prices Index (Wednesday) as a prologue to CPI reading (Thursday).
USD/JPY forming double bottom
Looks like traders are preparing for the march towards 104.00 peak. The pair have built small double bottom during last week which happened to be second leg of big, 5-week, double bottom – first leg is inversed SHS formation.
102.00 is still a good resistance that reversed price in early trading this week.
We think that 101.70/60 is the support that may decide if reversal will be continued but heavy market could reach further down to 101.40/30 and endanger some decent stops below.
On our way up towards 104.00 there is another decent obstacle 102.70 to 103.00 area. It is strong and may bounce the price but above we will probably find plenty of fuel for further rally.
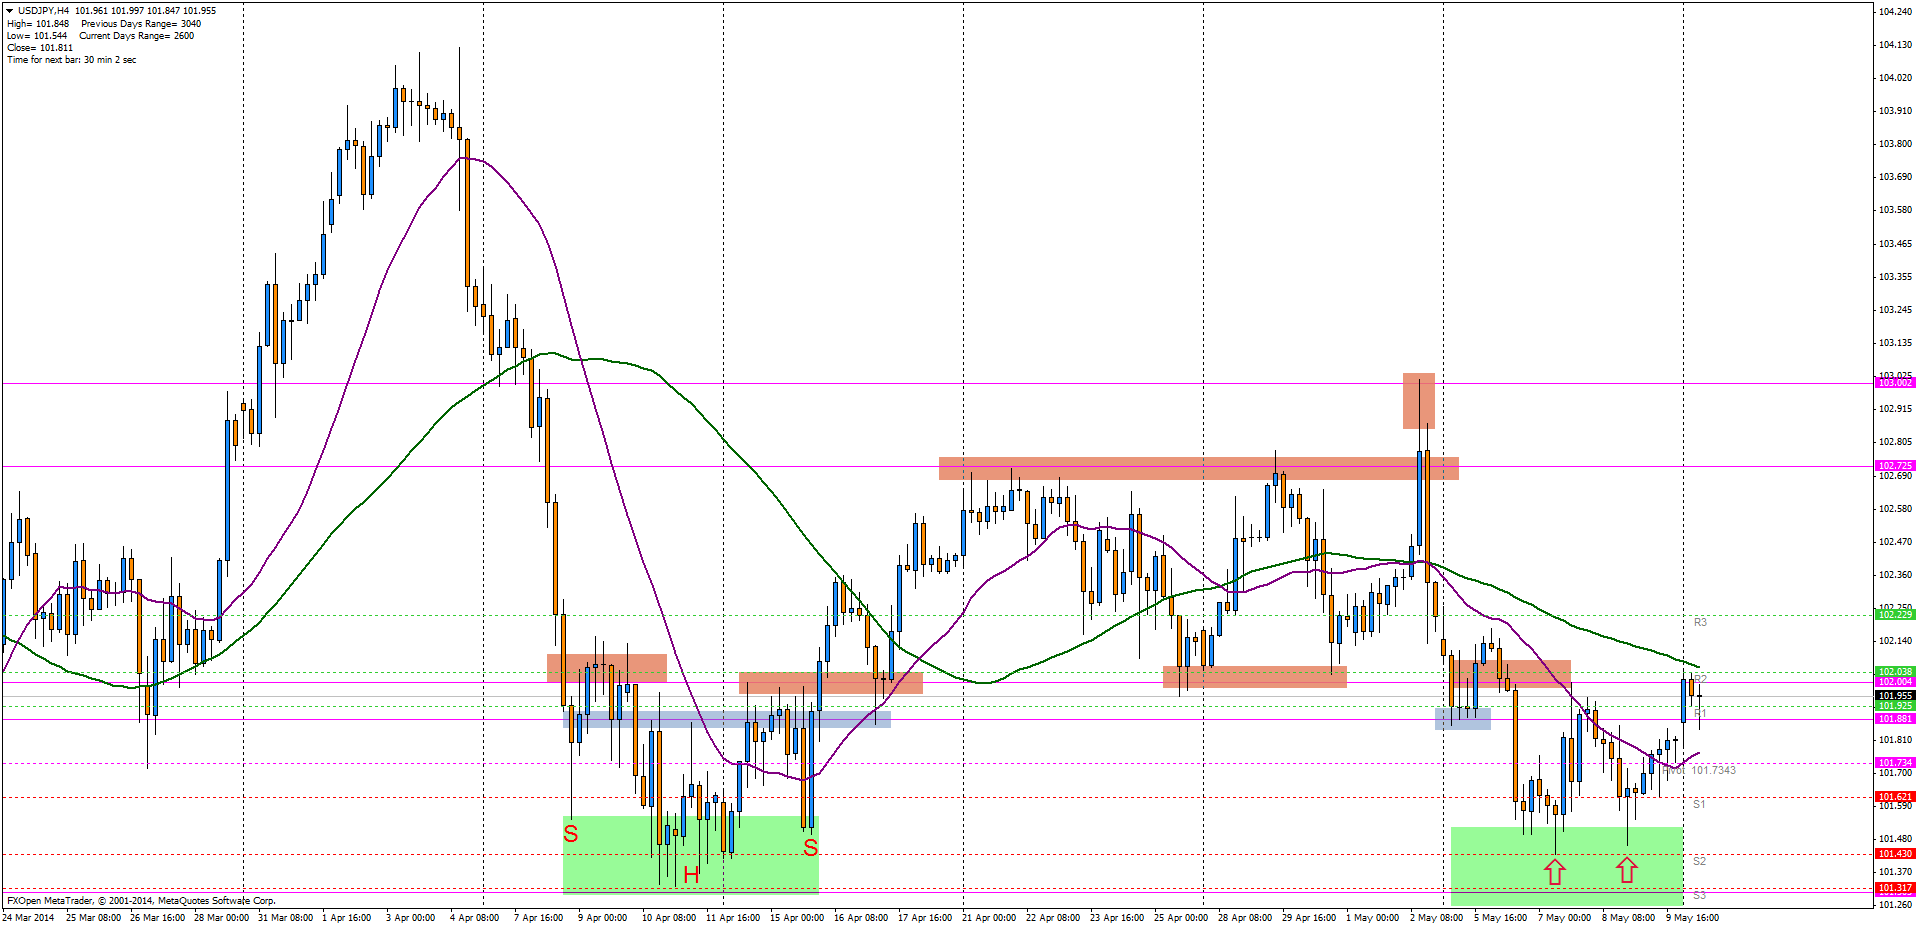
USD/JPY H4, click to enlarge.
Macro data for this week may impact USD/JPY pair mainly on Wednesday – US retail sales – and Thursday – US CPI data. Projections for both readings are pretty optimistic after CPI data picked up from 0.1% m/m to 0.2%. From JPY side we have BoJ governor’s – Haruhiko Kuroda – speech on Thursday night that could weaken Yen since markets speculate about probable BoJ action after weaker data and sales tax hike in April. Also preliminary GDP data may be of some importance but probably Kuroda’s speech will gain most attention.
Please remember that USD/JPY pair is strictly tied to traders’ mood and there is some data coming this week that could affect market’s sentiment and therefore USD/JPY price.
–
NZD/USD forms bearish Pinbar on the top
We were analyzing this pair in Wednesday outlook, and we anticipated downward move correctly. It’s significant fact, that pair gave several reversal signals that were unsuccessful proving weakness of the demand side. In the end previous week turned out to be bearish Pinbar that tested 2011 peak with its upper wick.
With such strong sell signal we would look for some resistance areas that may force price to resume downward move:
0.8630 – most recent corrective structure from Friday
0.8640/50 – today’s Pivot R1, Fibonacci retracement 23.6% of last week, significant level for last couple weeks, 24/48 EMA channel.
0.8670 – today’s Pivot R2, weekly high, beginning of price compression from last week, 38.2% retracement.
0.8690 – Pivot R3, Fibonacci retracement 50% of last week.
We have three good support levels for future Price Action:
0.8600 – Pivot S1, round level
0.8575 – provisory inverted SHS neckline, Pivot S2
0.8550/45 – inverted SHS shoulders line, Pivot S3, possible reversal point.
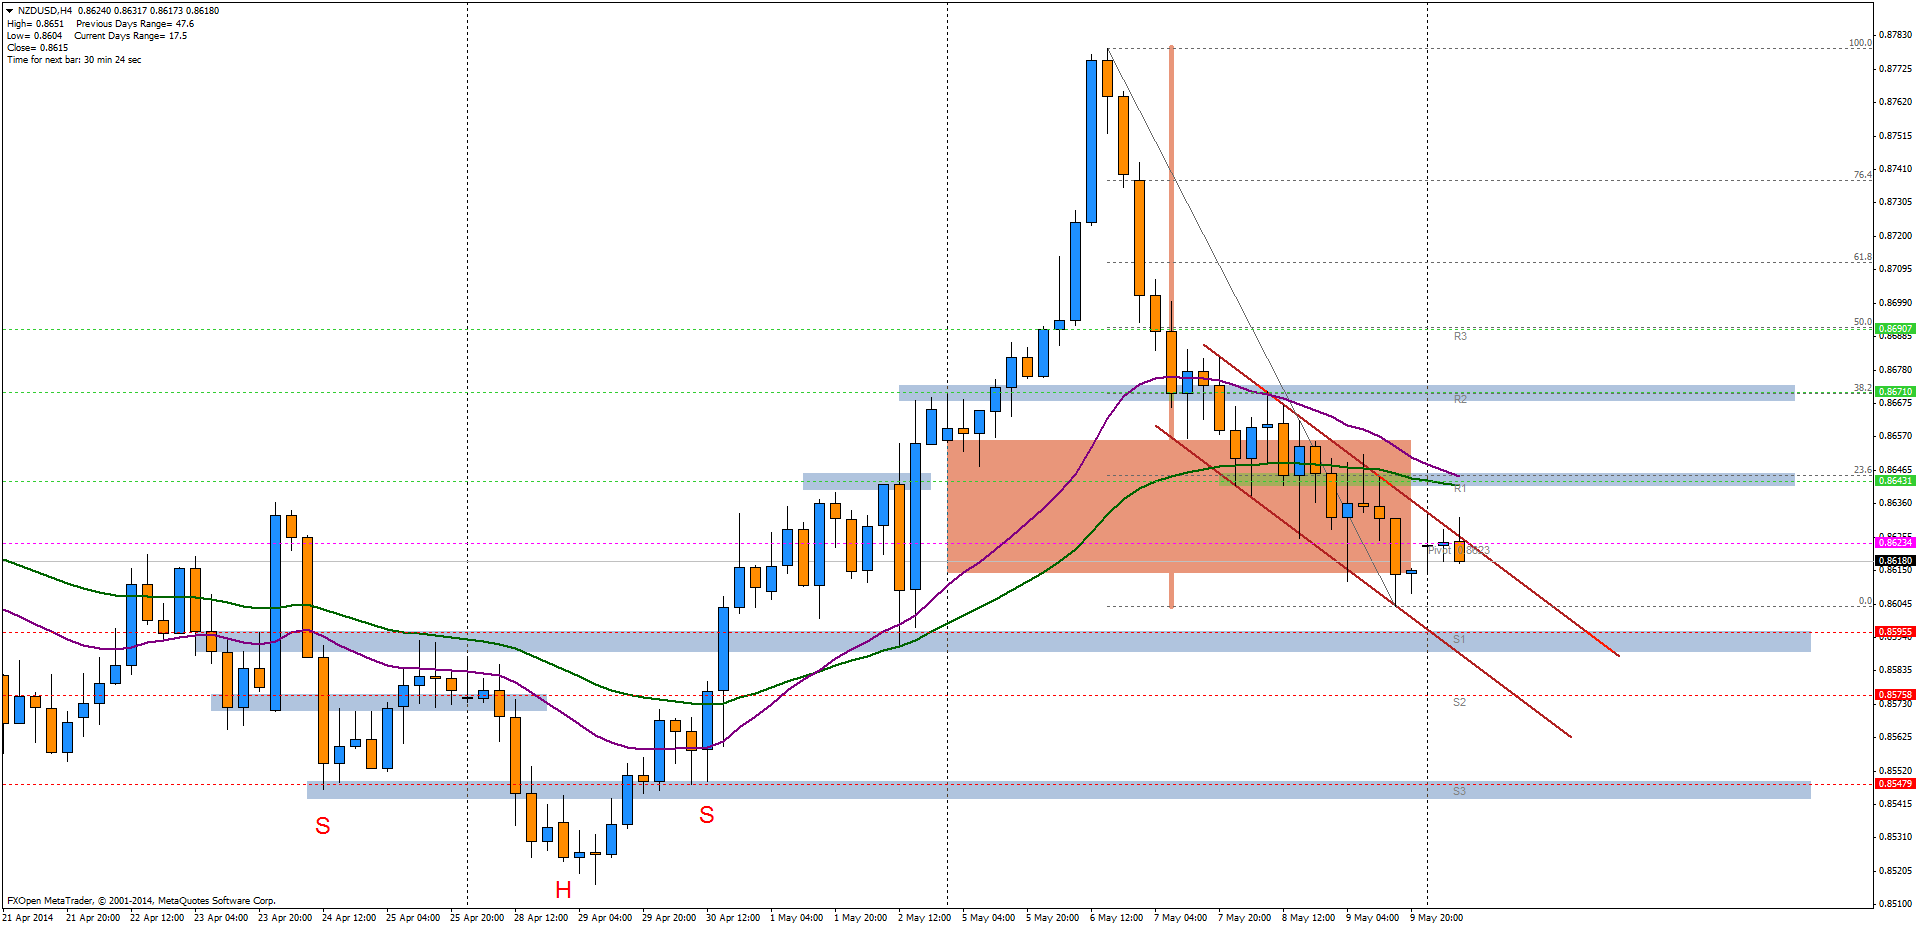
NZD/USD H4, click to enlarge.
Macro data incoming this week will affect not only USD (as mentioned earlier) but also NZD. Reserve Bank of New Zealand will publish the Financial Stability Report on Wednesday ended by governor’s Graeme Wheeler speech. Soon after that Retail sales will be released. After last week’s soft employment figures optimism may fade and retail data would come worse than previously predicted.
On Thursday we will also witness Annual Budget Release and Business Manufacturing Index.
Please keep in mind, that Chinese data also affects NZD, as well as AUD, currency because of tight trade connections between China and New Zealand.
Trade over 50 forex markets 24 hours a day with FXOpen. Take advantage of low commissions, deep liquidity, and spreads from 0.0 pips (additional fees may apply). Open your FXOpen account now or learn more about trading forex with FXOpen.
This article represents the opinion of the Companies operating under the FXOpen brand only. It is not to be construed as an offer, solicitation, or recommendation with respect to products and services provided by the Companies operating under the FXOpen brand, nor is it to be considered financial advice.
Stay ahead of the market!
Subscribe now to our mailing list and receive the latest market news and insights delivered directly to your inbox.


Latest articles

Weekly Market Insights with Gary Thomson: The Week of Central Banks and Earnings
In this video, we’ll explore the key economic events and market trends, shaping the financial landscape. Get ready for insights into financial markets to help you navigate the week ahead. Let’s dive in!
In this episode of Market

Intel at a Crossroads: Earnings Beat Meets Technical Resistance
Intel has just delivered its strongest quarter in over fifteen years, and the market reaction says it all. Q2 2026 revenue surged 25% year-over-year to $16.1 billion, crushing the consensus estimate of $14.42 billion, while adjusted EPS of

Tesla: Complex Range Structure Breaks Down Following Quarterly Earnings
Tesla released its Q2 2026 results after the market closed on 22 July. Revenue increased 26% year-on-year to $28.24 billion, while vehicle deliveries reached a record 480,126 units. However, operating margin fell sharply to 1.4%, down from