


Fibonacci Retracement Strategies
FXOpen

Fibonacci retracements are a cornerstone in the toolkit of many traders, offering a mathematical approach to identifying potential areas where reversals may occur. This article delves into the intricacies of using Fibonacci retracements, covering everything from basic understanding to strategies involving other indicators. Read on to gain insights into how to effectively incorporate these levels into your trading strategy.
What Are Fibonacci Retracements?
Fibonacci retracements are a popular technical analysis tool used to identify potential support and resistance levels on a chart. Developed around the concept of the Fibonacci sequence—a series of numbers where each number is the sum of the two preceding ones—the Fibonacci indicator applies this mathematical formula to financial markets.
Key retracement levels are often considered at 38.2%, 50%, and 61.8% of a price move. The 61.8% level, in particular, is frequently referred to as the Fibonacci retracement golden ratio, owing to its significance in both nature and financial markets. Traders commonly use these areas to anticipate where the price may reverse, thus providing strategic entry and exit points.
Fibonacci Retracements: How to Use Them
Using the Fibonacci tool for trading begins with identifying a significant swing, either an uptrend or a downtrend, on the chart. The tool is then applied at the swing low and swing high of the price movement. In an uptrend, it starts at the swing low and ends at the swing high; in a downtrend, it's the opposite. This action plots horizontal lines at the key Fibonacci levels, providing potential areas where price could reverse.
Concerning the Fibonacci retracement time frame, it's essential to know that this tool can be applied across various time frames—from one-minute charts to monthly charts. However, the reliability of the retracement levels often increases on higher time frames. That means those plotted on daily or weekly charts generally offer stronger support or resistance compared to those on shorter time frames.
Strategies Using Fibonacci Retracements
In trading, combining Fibonacci retracements with other technical indicators can significantly enhance decision-making. Below are three distinct strategies that utilise these retracements in conjunction with other tools to identify high-probability trade setups.
To see how they work, consider following along in FXOpen’s free TickTrader platform. There, you’ll gain access to over 1,200 trading tools—including the ones featured in this article.
Fibonacci Retracement with Moving Average Crossover
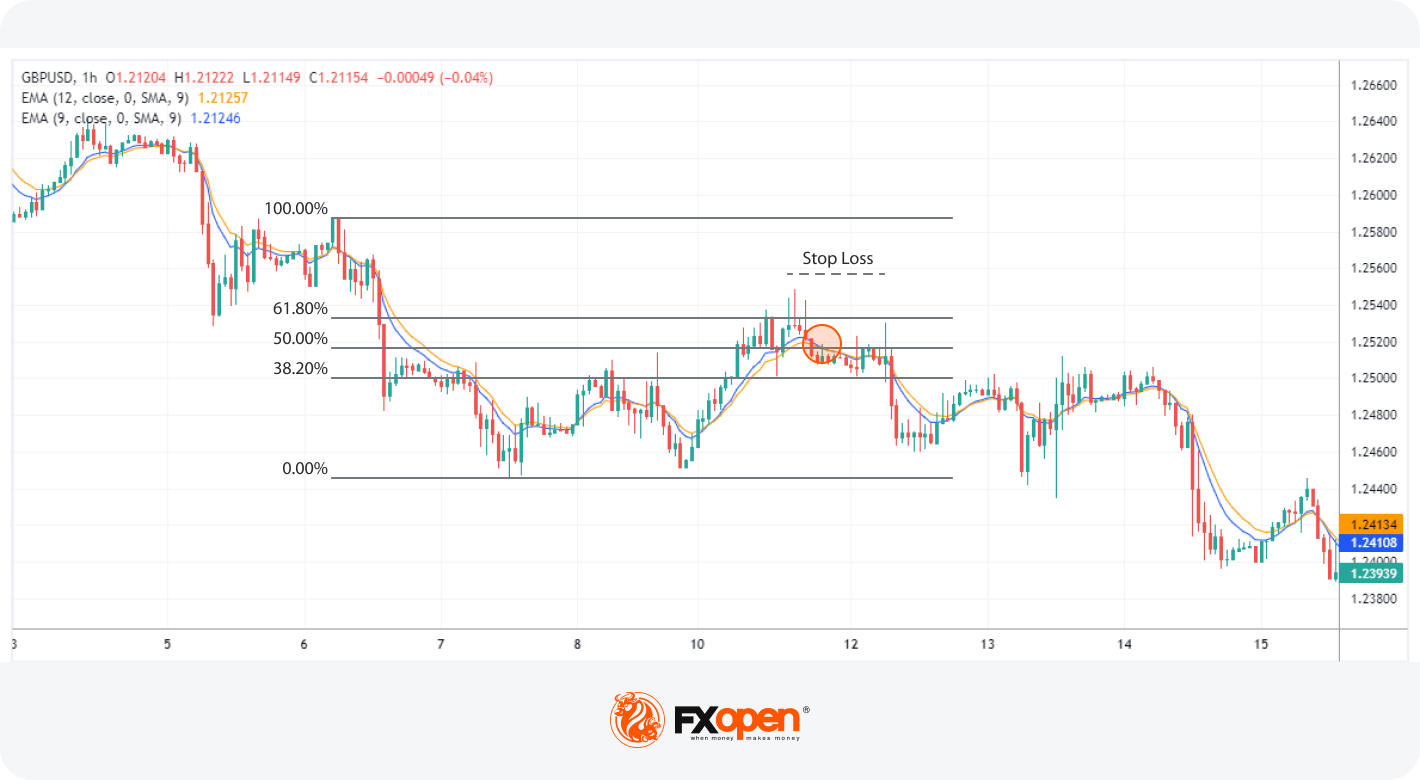
In this Fibonacci trading strategy, traders combine Fibonacci retracements with two Exponential Moving Averages (EMAs) set to 9 and 12 periods to pinpoint entry and exit points. After identifying a trend, either bullish or bearish, they apply the retracement tool to gauge potential reversal zones. Specifically, the focus is on the 38.2%, 50%, and 61.8% retracement levels. If the price reacts at any of these zones—potentially confirmed by a bullish or bearish candlestick pattern—the next step is to observe the EMA indicators.
Entry
Traders often watch for a moving average crossover in the direction of the existing trend as an indication of potential entry.
Stop Loss
Stop losses may be placed above or below the nearest swing high or low. Alternatively, some opt for setting it beyond the next level, including 23.6% or 78.6%.
Take Profit
Profits are typically taken at the high or low of the retracement zone where the price initially reacted.
Fibonacci Retracement with Stochastic Oscillator
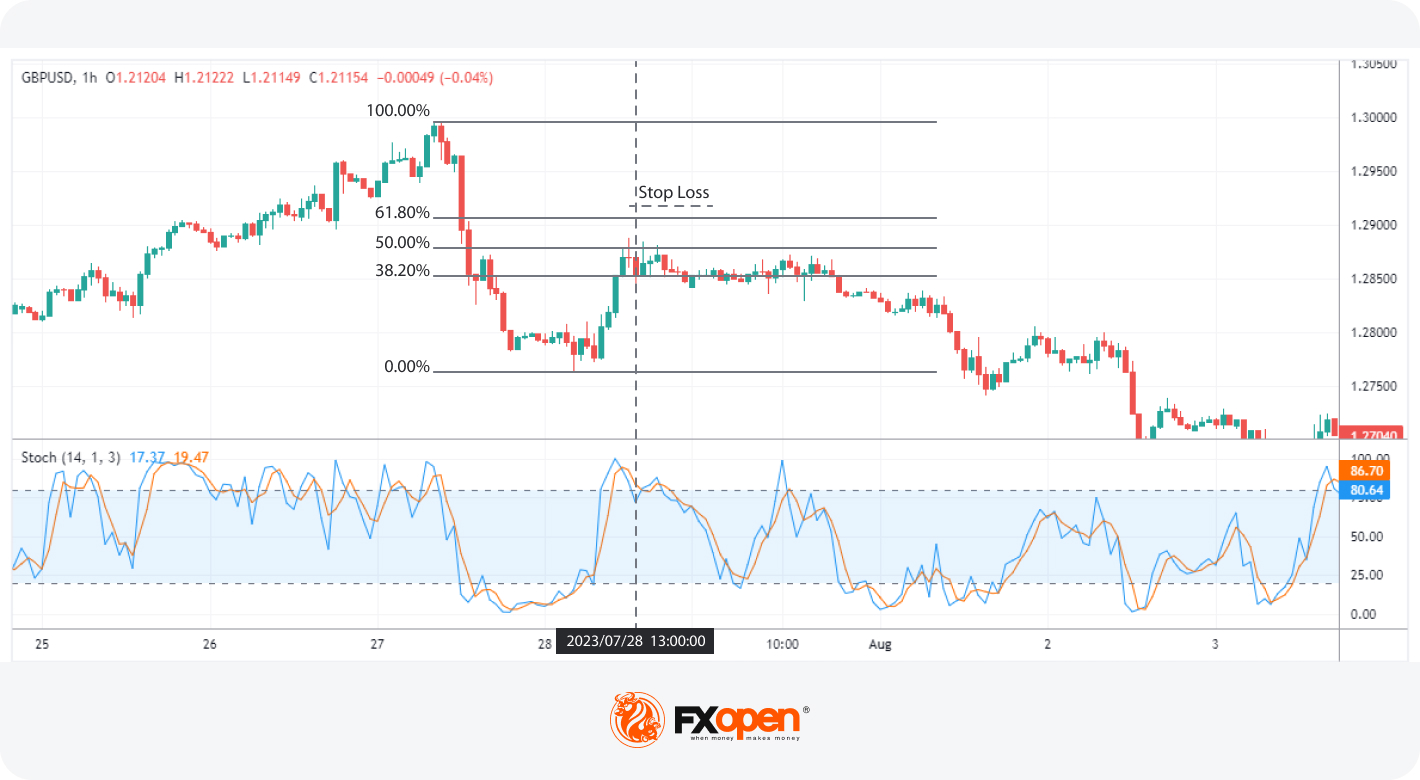
In this Fibonacci retracement strategy, the initial setup is similar to the one involving moving averages: traders identify a prevailing trend and apply Fibonacci retracements to find possible reversal zones at 38.2%, 50%, and 61.8%. The twist here is the use of the Stochastic Oscillator, a momentum indicator that ranges between 0 and 100. The oscillator helps identify overbought or oversold conditions when the price reaches these areas.
Entry
Traders generally look for the Stochastic Oscillator to exceed 80 (overbought) or drop below 20 (oversold) when the price reaches one of these Fibonacci zones. The entry signal often comes when the oscillator crosses back below 80 or above 20 after a reaction.
Stop Loss
Stop losses can be situated either above or below the closest swing high or swing low. Some traders may also choose to place it beyond an adjacent level, such as 23.6% or 78.6%.
Take Profit
Take profits are commonly located at the level where the price first exhibited a reaction, be it a high or a low.
50% Fibonacci Retracement Strategy
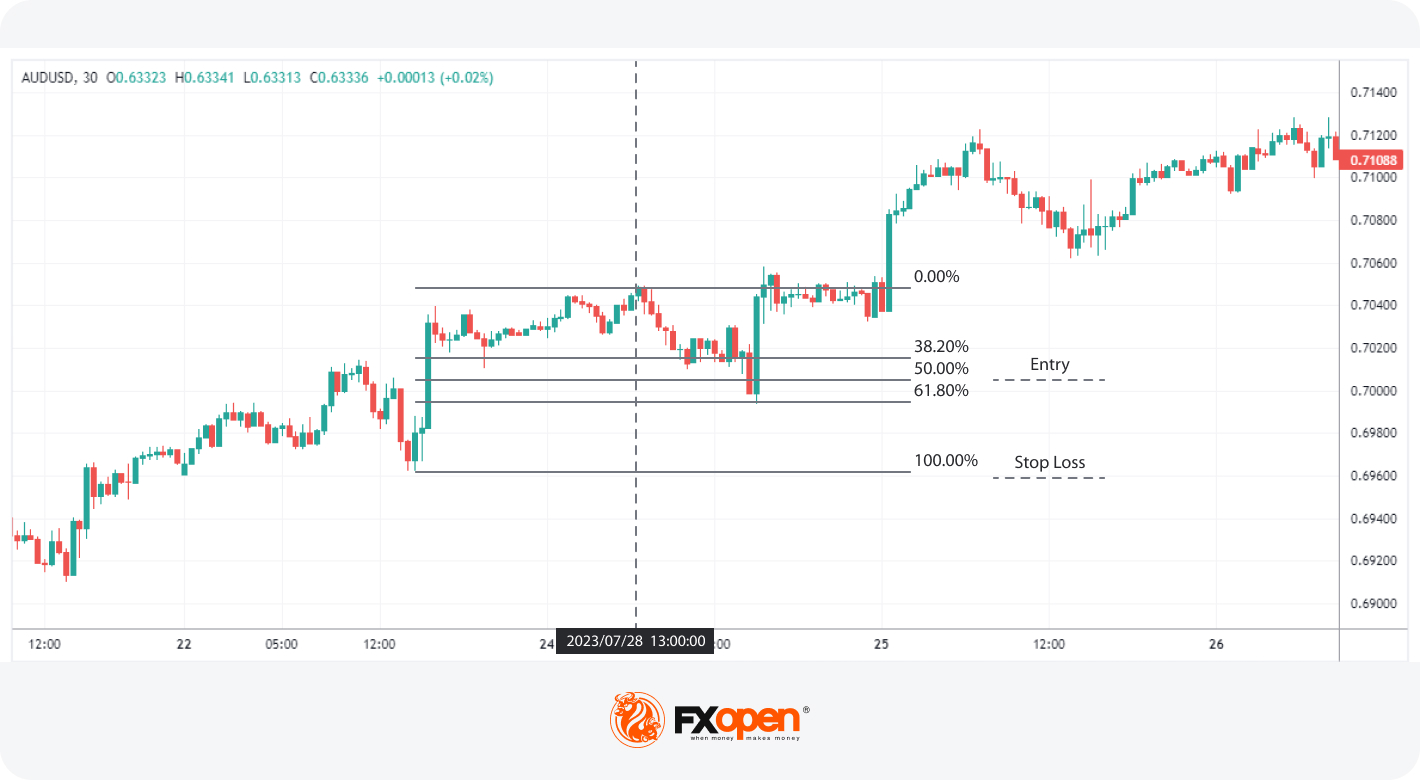
The 50% Fibonacci retracement strategy is a lower risk-to-reward approach but one that’s simple. Unlike other strategies that utilise multiple Fibonacci levels or additional indicators, this method zeroes in on the 50% mark as the focal point for entry, making it straightforward for traders. The 50% point specifically plays into the idea of mean reversion, which states that the price is likely to return to its average over time; however, traders can choose 38.2% or 61.8% areas if preferred.
Entry
Traders typically look to enter a position when the price reaches and reacts from the 50% retracement level, aiming to ride an existing trend.
Stop Loss
Due to the wider scope of this strategy, stop losses are usually set beyond the high or low of the entire Fibonacci retracement, offering a buffer against potential volatility.
Take Profit
Traders often opt to take profits at key support or resistance areas that offer at least a 2:1 reward-to-risk ratio. Alternatively, one may choose to forgo setting a take profit and instead trail a stop loss above or below new swing points that develop.
The Bottom Line
In summary, understanding and applying Fibonacci retracements can enhance your trading strategies, especially when used in conjunction with other technical indicators. These retracement levels offer high-probability zones where price might reverse, creating potential entry and exit points. If you're looking to implement a Fibonacci forex strategy in a secure, low-cost trading environment, consider opening an FXOpen account to access over 50 currency pairs and a comprehensive range of trading resources.
This article represents the opinion of the Companies operating under the FXOpen brand only. It is not to be construed as an offer, solicitation, or recommendation with respect to products and services provided by the Companies operating under the FXOpen brand, nor is it to be considered financial advice.
Stay ahead of the market!
Subscribe now to our mailing list and receive the latest market news and insights delivered directly to your inbox.


Latest articles

Weekly Market Insights with Gary Thomson: US Inflation, UK GDP, Chair Warsh Testimony, and Earnings
In this video, we’ll explore the key economic events and market trends, shaping the financial landscape. Get ready for insights into financial markets to help you navigate the week ahead. Let’s dive in!
In this episode of Market

GBP/AUD Analysis: The Tug-of-War Begins
Oil is back in the driver's seat, and both the pound and the aussie are feeling its grip. The Bank of England held rates at 3.75% in June, but with UK inflation at 2.8% and crude oil climbing

Australian Dollar Holds Above the Current Market Profile
The minutes from the Reserve Bank of Australia's (RBA) June meeting, released on 30 June, suggested that policymakers are not yet ready to rule out further policy tightening. Board members noted persistent excess demand and broad-based inflationary pressures across the