


Forex Correlation and Diversification Strategies
FXOpen

In forex trading, currency correlation and diversification strategies are vital tools for managing risk and optimising returns. This article explores the nuances of these techniques, providing traders with insights to navigate the forex market effectively using currency correlation.
Understanding Forex Correlation and Diversification
In forex trading, understanding the correlation between currencies is pivotal. This concept refers to how currency pairs move in relation to each other. For example, some pairs exhibit positive correlation, moving in tandem, while others show negative correlation, moving in opposite directions. Grasping these correlations aids traders in analysing market movements and in developing strategies that may minimise risks.
Currency diversification plays a crucial role in this context. By diversifying their portfolio across various currencies and not just sticking to a single pair, traders can reduce their exposure to market volatility. This strategy involves investing in currency pairs with different correlations, balancing the risk associated with currency movements. Effective diversification in trading also includes understanding how global economic factors can affect different currencies, thus allowing traders to hedge against potential losses and capitalise on varied market dynamics.
Correlation Breakout Strategy
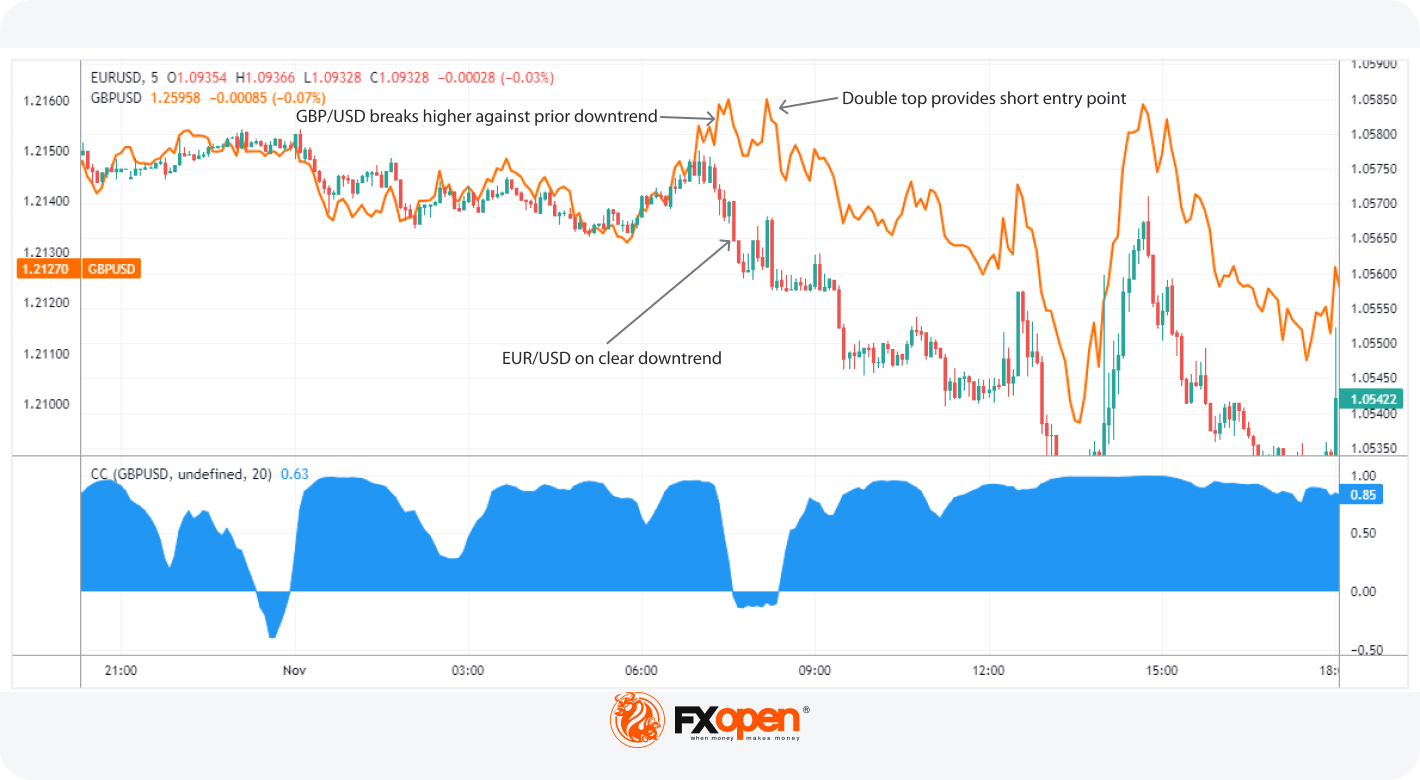
The Correlation Breakout Strategy is a nuanced forex correlation strategy used by traders to capitalise on intermittent shifts in currency pair relationships. In essence, it involves monitoring positive correlations in currency pairs and identifying moments when this correlation breaks and turns negative. This divergence often signals a unique trading opportunity.
A practical tool in this strategy is the correlation coefficient, which can be found in FXOpen’s free TickTrader platform. This indicator quantifies the degree of correlation between pairs, with a value ranging from -1 to 1. Typically, a strong positive correlation is indicated by values close to 1. However, when traders observe this coefficient turning negative, particularly falling below -0.5, it signals a noteworthy divergence from the usual pattern. This divergence can be a precursor to a significant market move.
When such a breakout occurs, the theory states that traders focus on the pair with the most apparent directional movement. The assumption here is that this pair will continue on its trajectory. Traders then anticipate that the correlated pair will follow suit, aligning back to its typical correlation pattern.
For example, take EUR/USD and GBP/USD, which are known for their high positive correlation. If they suddenly start moving in opposite directions, with EUR/USD showing a clear trend while GBP/USD shows mixed signals, it’s likely GBP/USD will eventually follow EUR/USD.
Hedging With Negatively Correlated Pairs
Hedging using negative correlation in currency pairs is a strategy that allows traders to manage risk effectively. In this approach, the trader takes positions in two currency pairs that typically move in opposite directions. The goal is to offset potential losses in one trade with gains in another, thus mitigating overall risk.
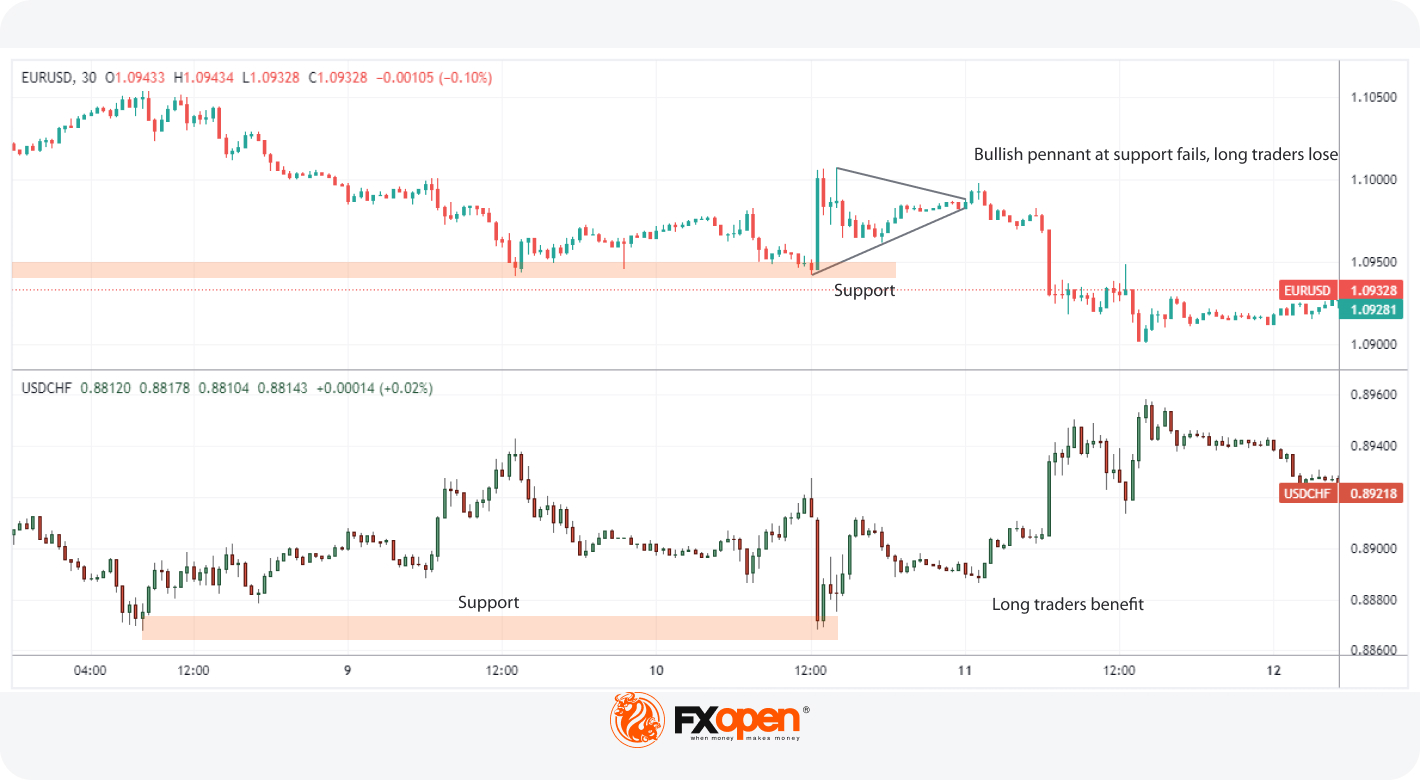
Consider a scenario where a trader spots a long setup in USD/JPY but harbours some uncertainty about the trade's potential. To hedge this position, the trader can also go long on AUD/USD. Here's why this works: USD/JPY and AUD/USD often exhibit a negative correlation. When USD/JPY rises, AUD/USD tends to fall, and vice versa. By going long on both, the trader is effectively insuring their trade against unexpected movements.
In the example shown, EUR/USD forms a pennant after a bullish reaction from a support level, reflecting a potential upward continuation. Simultaneously, USD/CHF also shows a bullish reaction from its support level. By going long on both pairs, the trader capitalises on the potential bullish movement in USD/CHF while hedging against the risk in EUR/USD. This strategy slightly reduces the potential gain but offers protection against losses, a prudent approach in uncertain market conditions.
Confirming Signals with Correlated Pairs
When using currency correlation in forex trading, one effective strategy is looking at correlated pairs to confirm trade signals. This involves first identifying a potential setup on one currency pair, such as a chart pattern or indicator signal, and then seeking additional confirmation from a correlated pair.
For instance, a trader might observe a rising wedge on EUR/USD, a pattern typically indicating a bearish reversal. To strengthen their analysis, the trader can look at a positively correlated pair like AUD/USD. If AUD/USD is already showing a breakdown, it adds confluence to the bearish outlook for EUR/USD, reinforcing the trader's decision to anticipate a potential decline and go short.
In the chart above, a trader might notice the bearish divergence between EUR/USD and the RSI (Relative Strength Index), signalling potential downward movement. NZD/USD, a correlated pair, is already trending downwards, providing additional confirmation of the bearish signal on EUR/USD. This method of using correlated pairs for validation can significantly increase the accuracy of trade entries in forex trading.
Limitations of Currency Correlations
While currency correlations are a valuable tool in forex trading, they have certain limitations:
- Temporal Variability: Correlations can change over time due to economic, political, or unforeseen global events, affecting their reliability.
- False Signals: Correlations do not guarantee effective trades. Misinterpreting correlation data can lead to false signals and potential losses.
- Data Overload: Relying too heavily on correlation data can lead to analysis paralysis, where a trader struggles to make decisions due to excessive information.
- Underlying Market Conditions: Correlations often disregard underlying market conditions, which can be crucial for understanding currency movements.
- Lagging Indicators: Correlations may act as lagging indicators, meaning they reflect past market behaviours and might not accurately identify future movements.
The Bottom Line
Mastering forex correlation and diversification strategies is essential for any trader seeking to thrive in the forex market. These approaches offer a roadmap to understanding market dynamics, managing risk, and identifying potential opportunities. For traders eager to apply these strategies in real-world scenarios, opening an FXOpen account can be an essential step towards harnessing the full potential of these sophisticated trading techniques in the global forex marketplace.
This article represents the opinion of the Companies operating under the FXOpen brand only. It is not to be construed as an offer, solicitation, or recommendation with respect to products and services provided by the Companies operating under the FXOpen brand, nor is it to be considered financial advice.
Stay ahead of the market!
Subscribe now to our mailing list and receive the latest market news and insights delivered directly to your inbox.


Latest articles

AUD/CAD: Months of Indecision — Is a Breakout Finally Coming?
The Australian dollar has clawed back most of its end-of-June losses, when it touched three-month lows against the greenback amid escalating Middle East tensions. Since then, sentiment has improved: the RBA's Assistant Governor Sarah Hunter signalled the board stands ready

USD/JPY: Battling at the Top of the Triangle
On 3 July, Japan's Finance Minister, Satsuki Katayama, stated that the Ministry of Finance remains in close contact with US authorities regarding developments in USD/JPY as the yen traded near its weakest level in almost 40 years. Similar verbal

Dow Jones (DJIA): Consolidation Beyond the Trend
Federal Reserve Chair Kevin Warsh testified before Congress on 14–15 July, reaffirming the Fed's commitment to bringing inflation back to target while providing no clear guidance on the future path of interest rates. Meanwhile, June inflation data came in