


FXOpen
GBP/USD is facing resistance near 1.4000 and it is correcting gains. EUR/GBP is consolidating above 0.8550 and it could start a decent increase if it clears 0.8600.
Important Takeaways for GBP/USD and EUR/GBP
- The British Pound is struggling to settle above the 1.4000 resistance zone.
- There was a break below a key bullish trend line with support at 1.3925 on the hourly chart of GBP/USD.
- EUR/GBP is forming a strong support base above 0.8550 level.
- There was a break above a connecting bearish trend line at 0.8575 on the hourly chart.
GBP/USD Technical Analysis
After a sharp rally, the British Pound failed to stay above 1.4100 against the US Dollar. The GBP/USD pair declined and it even settled below the 1.4000 support zone.
It even dived towards the 1.3800 level and broke the 50 hourly simple moving average. Recently, there was a strong upward move above the 1.3900 level, but the pair struggled to clear the 1.4000 resistance zone.
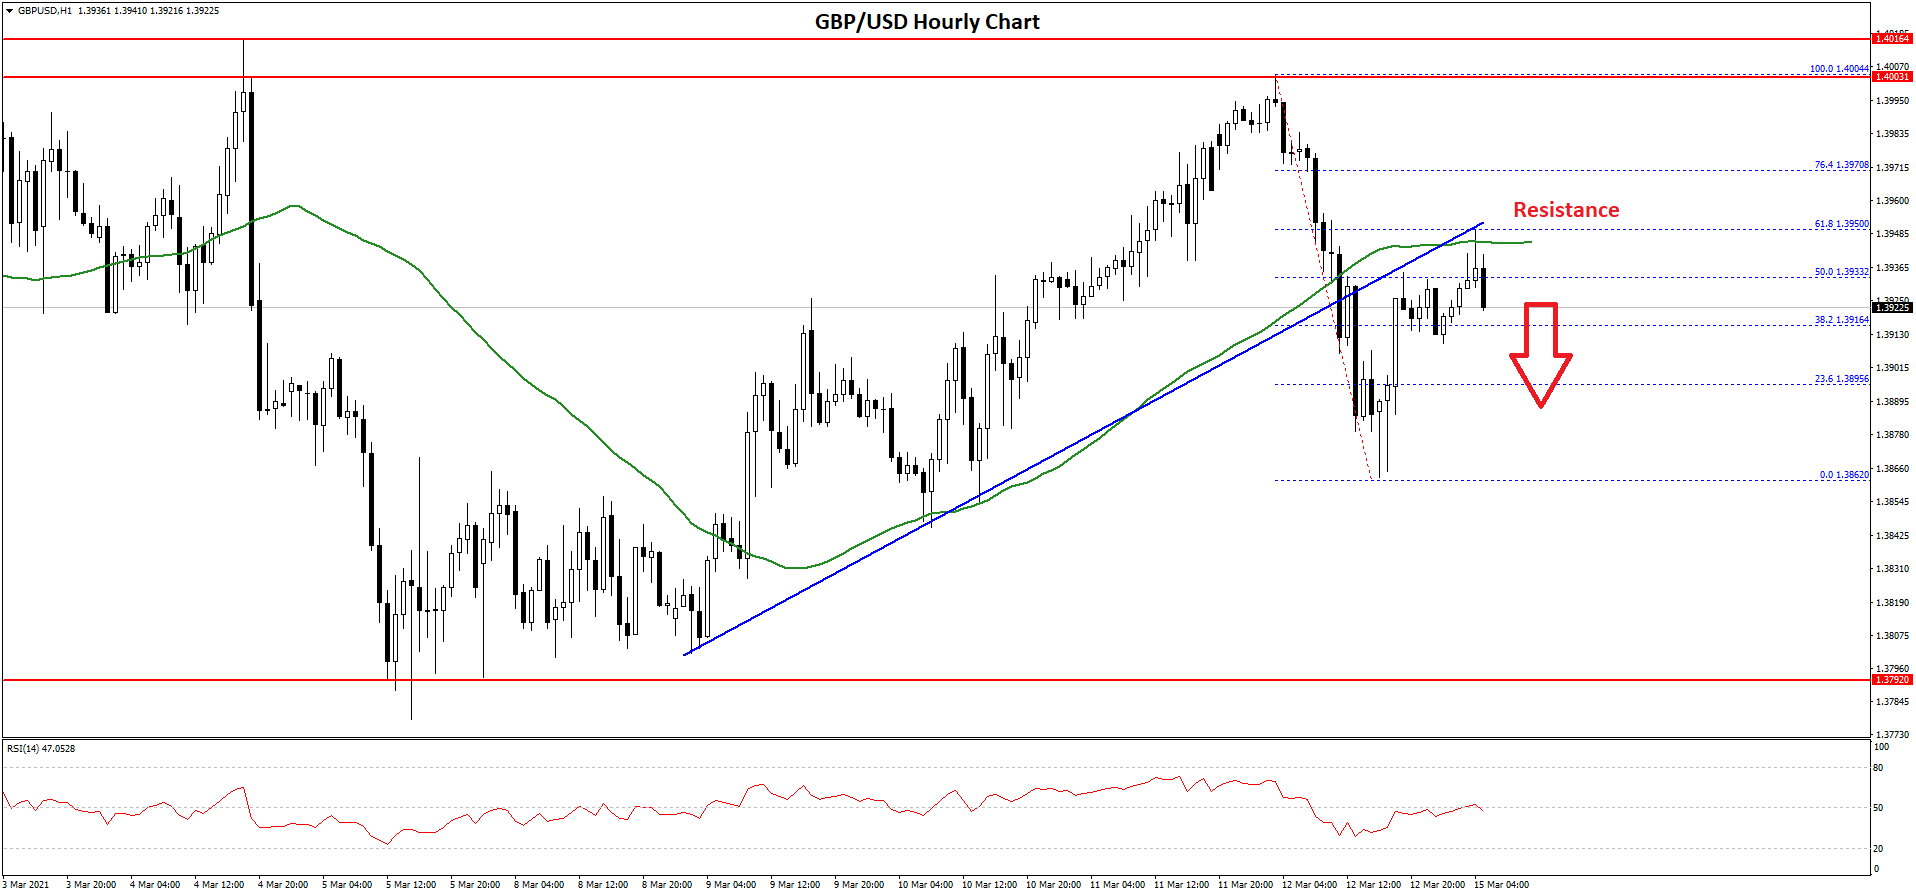
A high is formed near 1.4004 on FXOpen before the pair dipped again. There was a break below a key bullish trend line with support at 1.3925 on the hourly chart of GBP/USD.
It traded as low as 1.3862 before recovering higher. There was a break above the 50% Fib retracement level of the downward move from the 1.4004 high to 1.3862 low.
However, the pair is facing resistance near the 1.3950 level and the 50 hourly simple moving average. The 61.8% Fib retracement level of the downward move from the 1.4004 high to 1.3862 low is also acting as a resistance.
The main resistance is still near 1.4000, above which the pair could rally again. On the downside, the 1.3900 level is a decent support. The next major support sits near the 1.3850 level, below which the pair could slide towards the 1.3800 level. Any more losses might call for a test of the 1.3720 support zone.
EUR/GBP Technical Analysis
The Euro started a major decline from well above the 0.8650 level against the British Pound. The EUR/GBP pair broke the 0.8620 and 0.8600 support levels.
It tested the 0.8550 zone and it seems like the pair is now forming a strong support base near 0.8550. It recovered above the 0.8570 resistance and the 50 hourly simple moving average. The pair traded above the 23.6% Fib retracement level of the downward move from the 0.8651 high to 0.8548 low.
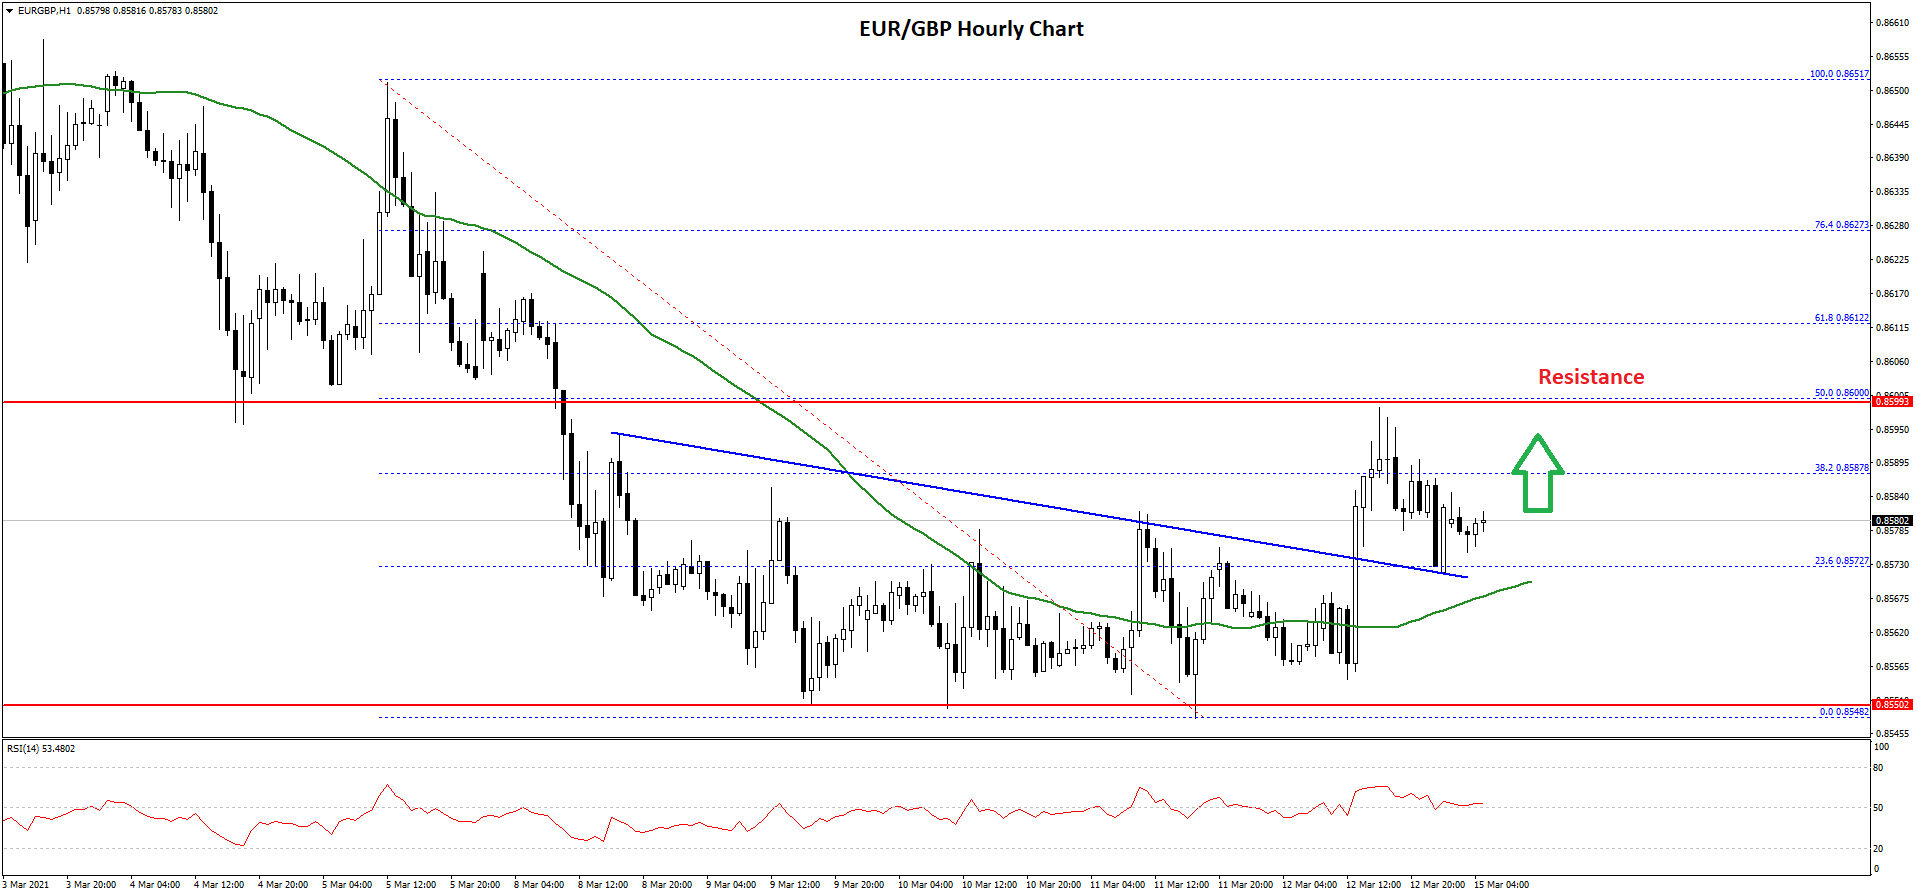
There was also a break above a connecting bearish trend line at 0.8575 on the hourly chart. The pair spiked above 0.8590, but it seems like the previous support at 0.8600 is now acting as a strong resistance.
The 50% Fib retracement level of the downward move from the 0.8651 high to 0.8548 low is also near the 0.8600 level. The pair is now consolidating above the 0.8570 level and the 50 hourly simple moving average.
To start a strong increase, the pair must settle above the 0.8600 resistance. Any more gains could lead the pair towards the 0.8650 level.
On the downside, the 0.8570 level and the 50 hourly simple moving average are initial supports. The main support is now forming near the 0.8550 level, below which there is a risk of a drop towards the 0.8520 level.
Trade over 50 forex markets 24 hours a day with FXOpen. Take advantage of low commissions, deep liquidity, and spreads from 0.0 pips (additional fees may apply). Open your FXOpen account now or learn more about trading forex with FXOpen.
This article represents the opinion of the Companies operating under the FXOpen brand only. It is not to be construed as an offer, solicitation, or recommendation with respect to products and services provided by the Companies operating under the FXOpen brand, nor is it to be considered financial advice.
Stay ahead of the market!
Subscribe now to our mailing list and receive the latest market news and insights delivered directly to your inbox.


Latest articles

Market Insights with Gary Thomson: Where Are Oil, Gas & Global Indices Heading?
In this video, we’ll explore the key economic events and market trends, shaping the financial landscape. Get ready for insights into financial markets to help you navigate the week ahead. Let’s dive in!
In this episode of Market

Netflix (NFLX) Shares Pull Back After a 30% Surge
On 21 January, while analysing the NFLX chart, we:
→ identified a descending channel and a resistance zone around the $100 level;
→ noted that Netflix shares were showing a sustained downtrend. Selling pressure had been triggered primarily by reports of a

US Dollar Index (DXY) Rises Above the 100 Level
Today the US Dollar Index (DXY) climbed above the psychological 100 mark for the first time in 2026, supported by a tense fundamental backdrop, with the military conflict in the Middle East acting as the main driver.
→ Financial market participants