


FXOpen
GBP/USD started another decline from well above the 1.3120 level. GBP/JPY is rising and might gain pace above the 162.75 resistance zone
Important Takeaways for GBP/USD and GBP/JPY
· The British Pound started a fresh decline after it failed near 1.3150 against the US Dollar.
· There is a key bearish trend line forming with resistance near 1.3030 on the hourly chart of GBP/USD.
· GBP/JPY started a fresh increase after it cleared the 160.00 resistance zone.
· There is a major bullish trend line forming with support near 161.75 on the hourly chart.
GBP/USD Technical Analysis
This past week, the British Pound attempted a recovery wave above the 1.3120 level against the US Dollar. However, the GBP/USD pair failed to gain strength for a move above the 1.3150 resistance.
As a result, the pair reacted to the downside and traded below the 1.3100 level. There was a clear move below the 1.3050 support and the 50 hourly simple moving average. It even spiked below 1.3000 and traded as low as 1.2982 on FXOpen.
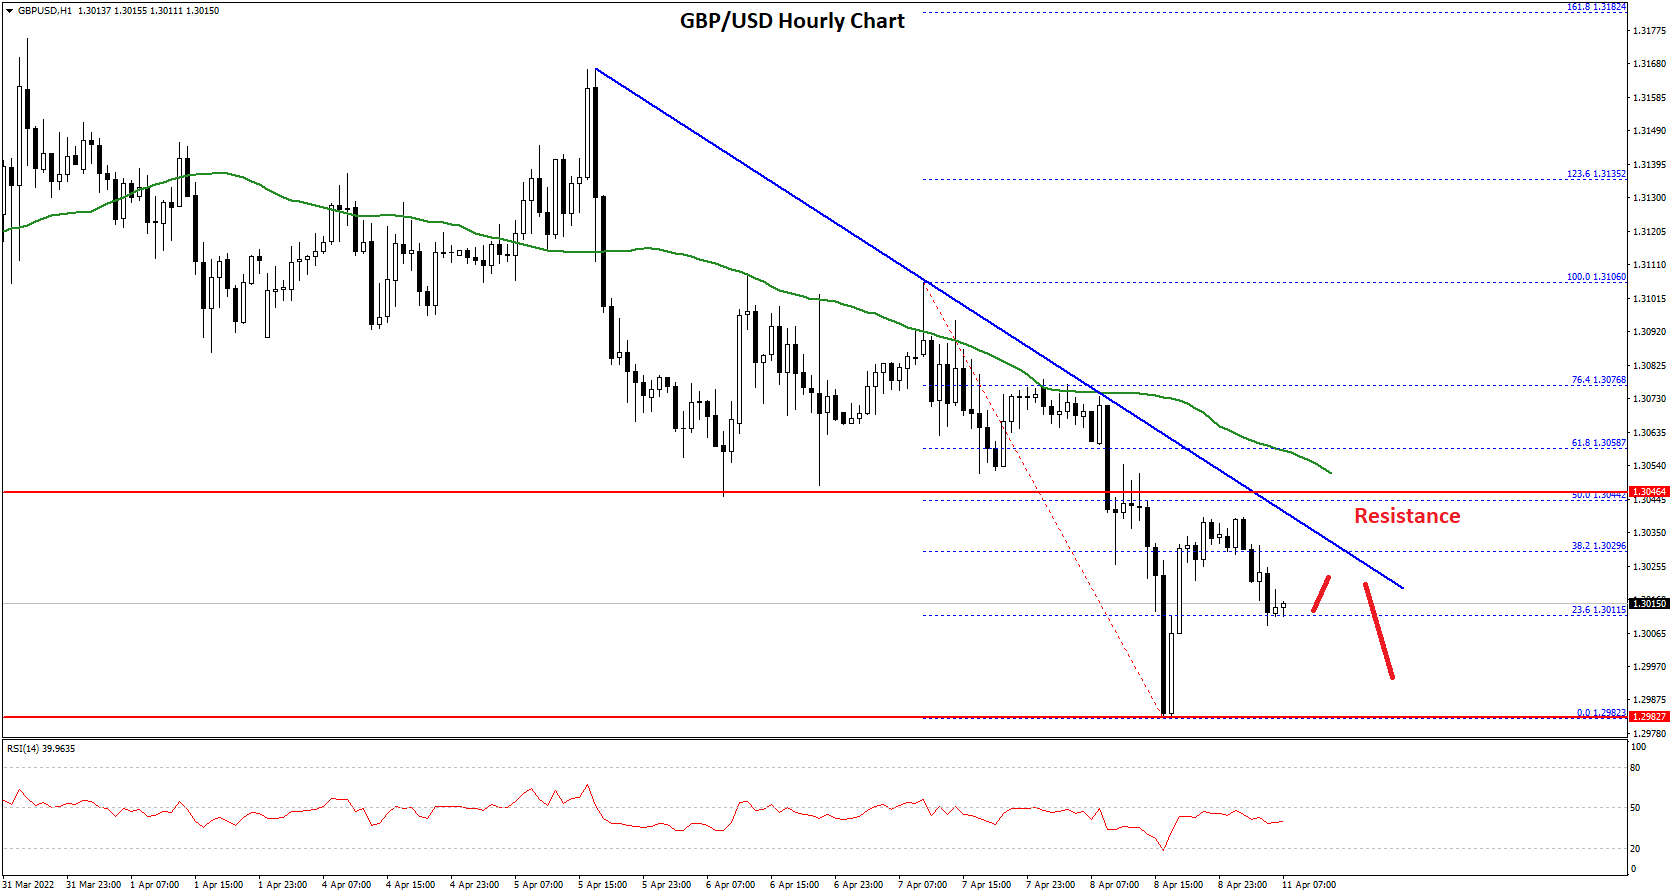
It is currently attempting an upside correction above 1.3000. There was a move above the 23.6% Fib retracement level of the recent decline from the 1.3106 swing high to 1.2982 low.
However, the pair is facing a major resistance near the 1.3040 and 1.3050 levels. There is also a key bearish trend line forming with resistance near 1.3030 on the hourly chart of GBP/USD. The 50% Fib retracement level of the recent decline from the 1.3106 swing high to 1.2982 low is also above the trend line.
The next major hurdle is near 1.3080, above which the pair could rise towards 1.3150 in the near term. If not, the pair might continue to decline below 1.3000.
The next major support is near the 1.2950 level. If there is a break below the 1.2950 support, the pair could test the 1.2880 support.
GBP/JPY Technical Analysis
The British Pound also started a fresh increase from well below the 160.00 level against the Japanese Yen. The GBP/JPY pair gained pace above the 160.50 level to enter a positive zone.
There was a clear move above the 161.50 level and the 50 hourly simple moving average. The pair traded as high as 162.67 and is currently consolidating gains.
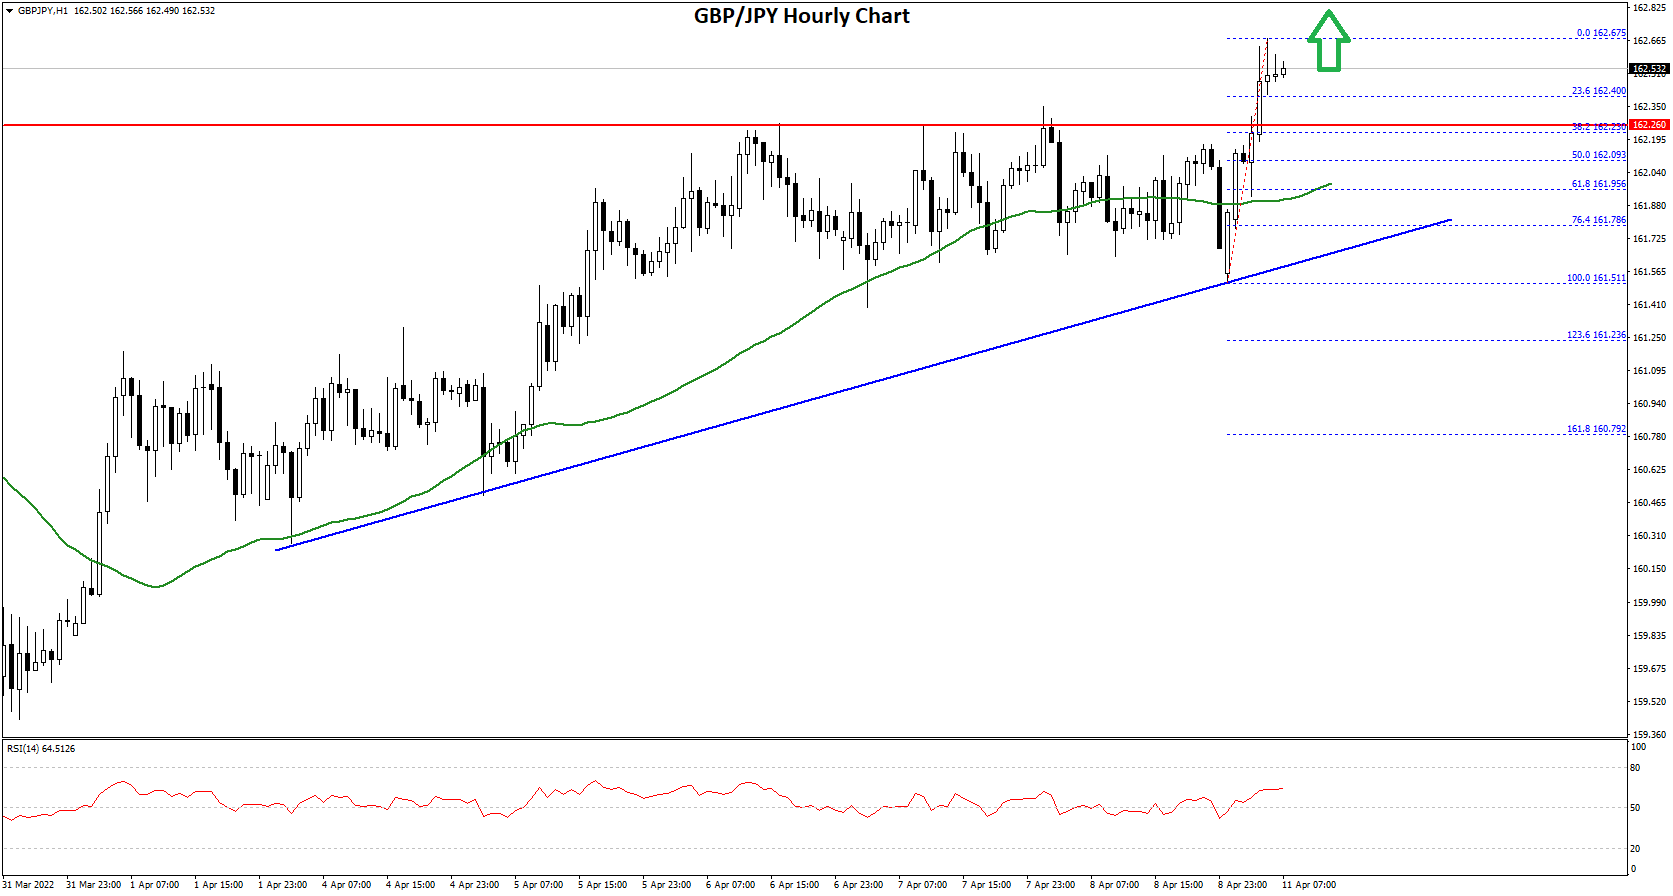
An initial support on the downside is near the 162.40 level. It is near the 23.6% Fib retracement level of the upward move from the 161.51 swing low to 162.67 high. The next major support is near the 162.00 level.
There is also a major bullish trend line forming with support near 161.75 on the hourly chart. An intermediate support might be the 50% Fib retracement level of the upward move from the 161.51 swing low to 162.67 high at 162.10 or the 50 hourly simple moving average.
If there is a downside break below the 162.00 support, the pair could decline towards the 161.50 support zone. Any more losses might send the pair towards the 161.20 level in the near term.
On the upside, GBP/JPY is facing resistance near the 162.75 level. The next key resistance could be 168.00. A clear break above the 168.00 resistance could push the pair towards the 168.40 resistance.
This forecast represents FXOpen Markets Limited opinion only, it should not be construed as an offer, invitation or recommendation in respect to FXOpen Markets Limited products and services or as financial advice.
This article represents the opinion of the Companies operating under the FXOpen brand only. It is not to be construed as an offer, solicitation, or recommendation with respect to products and services provided by the Companies operating under the FXOpen brand, nor is it to be considered financial advice.
Stay ahead of the market!
Subscribe now to our mailing list and receive the latest market news and insights delivered directly to your inbox.

Latest articles

Market Insights with Gary Thomson: Where Are Oil, Gas & Global Indices Heading?
In this video, we’ll explore the key economic events and market trends, shaping the financial landscape. Get ready for insights into financial markets to help you navigate the week ahead. Let’s dive in!
In this episode of Market

Netflix (NFLX) Shares Pull Back After a 30% Surge
On 21 January, while analysing the NFLX chart, we:
→ identified a descending channel and a resistance zone around the $100 level;
→ noted that Netflix shares were showing a sustained downtrend. Selling pressure had been triggered primarily by reports of a

US Dollar Index (DXY) Rises Above the 100 Level
Today the US Dollar Index (DXY) climbed above the psychological 100 mark for the first time in 2026, supported by a tense fundamental backdrop, with the military conflict in the Middle East acting as the main driver.
→ Financial market participants