


Gold Gaining Momentum While Oil Stays Bearish
FXOpen
Gold price started a solid upward move from the $1,238 low and broke the $1,260 resistance. Crude oil price remains in a downtrend and it could decline below $43.00 in the near term.
Important Takeaways for Gold and Oil
- Gold price gained a lot of bullish momentum above the $1,270 resistance against the US Dollar.
- There is a major ascending channel with support at $1,269 on the hourly chart of gold.
- Crude oil price is struggling to move past the $46.00 and $47.00 resistances.
- There is a key bearish trend line formed with resistance at $46.20 on the hourly chart of XTI/USD.
Gold Price Technical Analysis
Gold price remained a significant uptrend and it started a solid upward move from the $1,238 swing low against the US Dollar. The price broke the $1,240 and $1,255 resistance levels to enter a medium term uptrend.
There was a proper close above the $1,260 resistance and the 50 hourly simple moving average. The price climbed above the $1,270 and $1,275 resistance levels. A high was formed at $1,279 and later the price corrected lower.
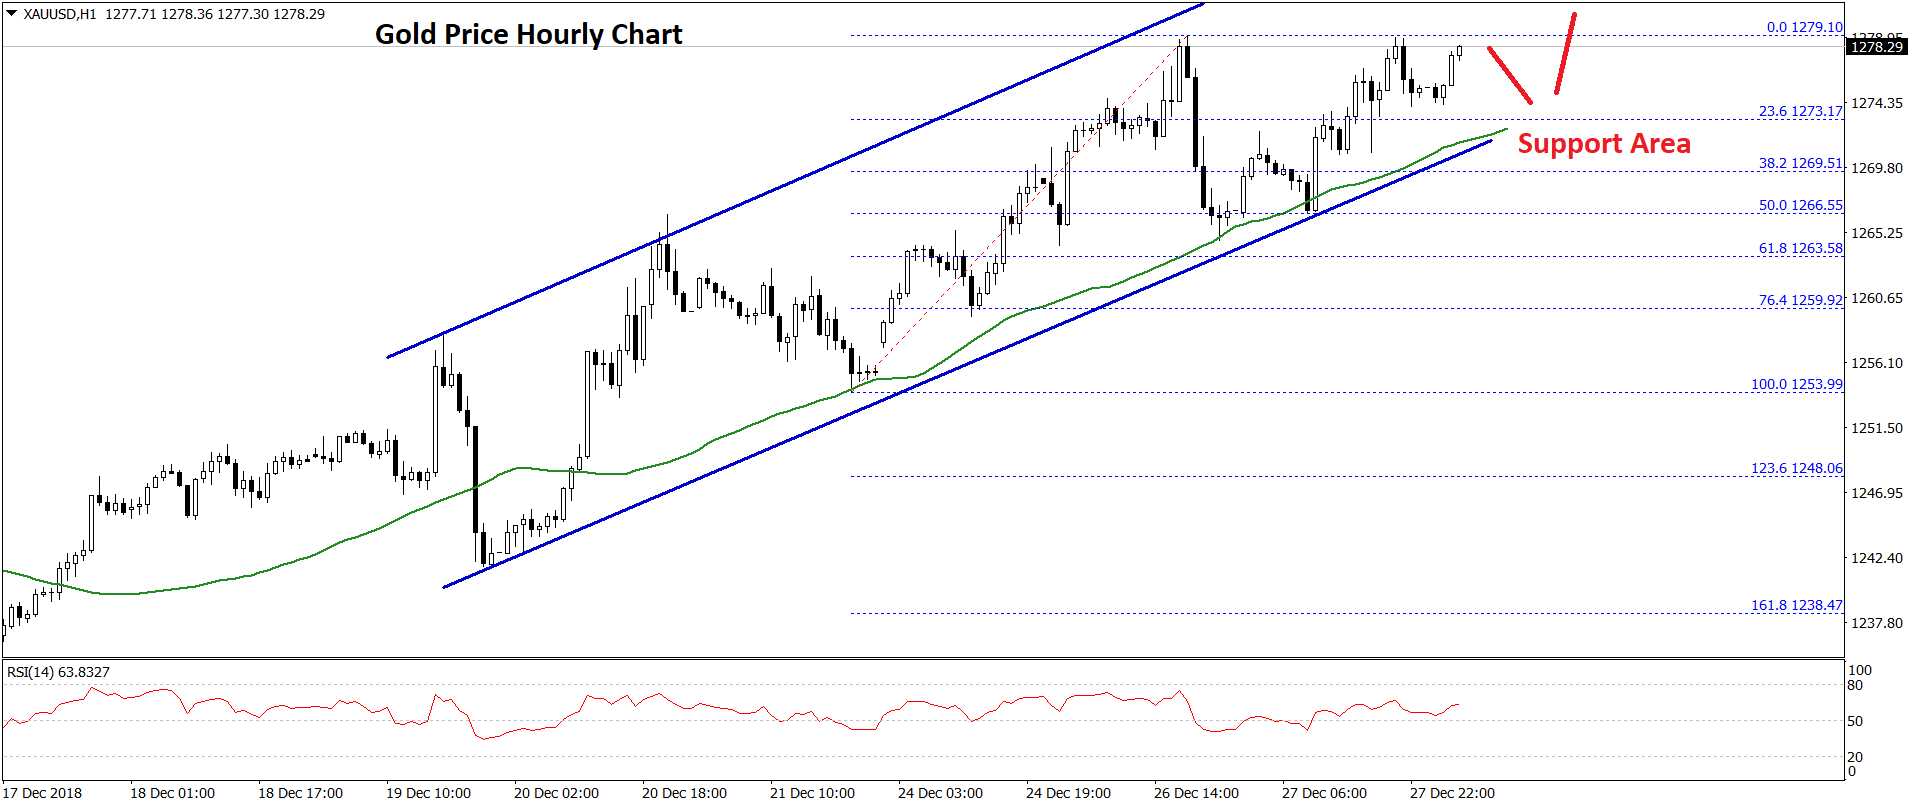
Sellers pushed the price below the $1,270 level and the 38.2% Fib retracement level of the last wave from the $1,253 low to $1,279 high. However, the price found support near the $1,265 level.
More importantly, there is a major ascending channel formed with support at $1,269 on the same chart. Besides, the 50% Fib retracement level of the last wave from the $1,253 low to $1,279 high. Should there be a downside break below the $1,266 and $1,265 support levels, there could be a strong downward move towards the $1,260 support.
On the upside, there is a major resistance at $1,279-$1,280, above which the price could move towards the $1,285 and $1,290. The next major resistance is near the $1,300 level.
Oil Price Technical Analysis
Crude oil price declined further below the $47.00 and $45.00 support levels against the US Dollar. The price even broke the $44.00 support level and traded towards the $42.00 level.
A low was formed at $42.11 and later started an upward move. The price jumped above the $45.00 and $46.00 resistance levels. However, the price struggled to clear the $47.00 barrier. Besides, there is a key bearish trend line formed with resistance at $46.20 on the hourly chart of XTI/USD.
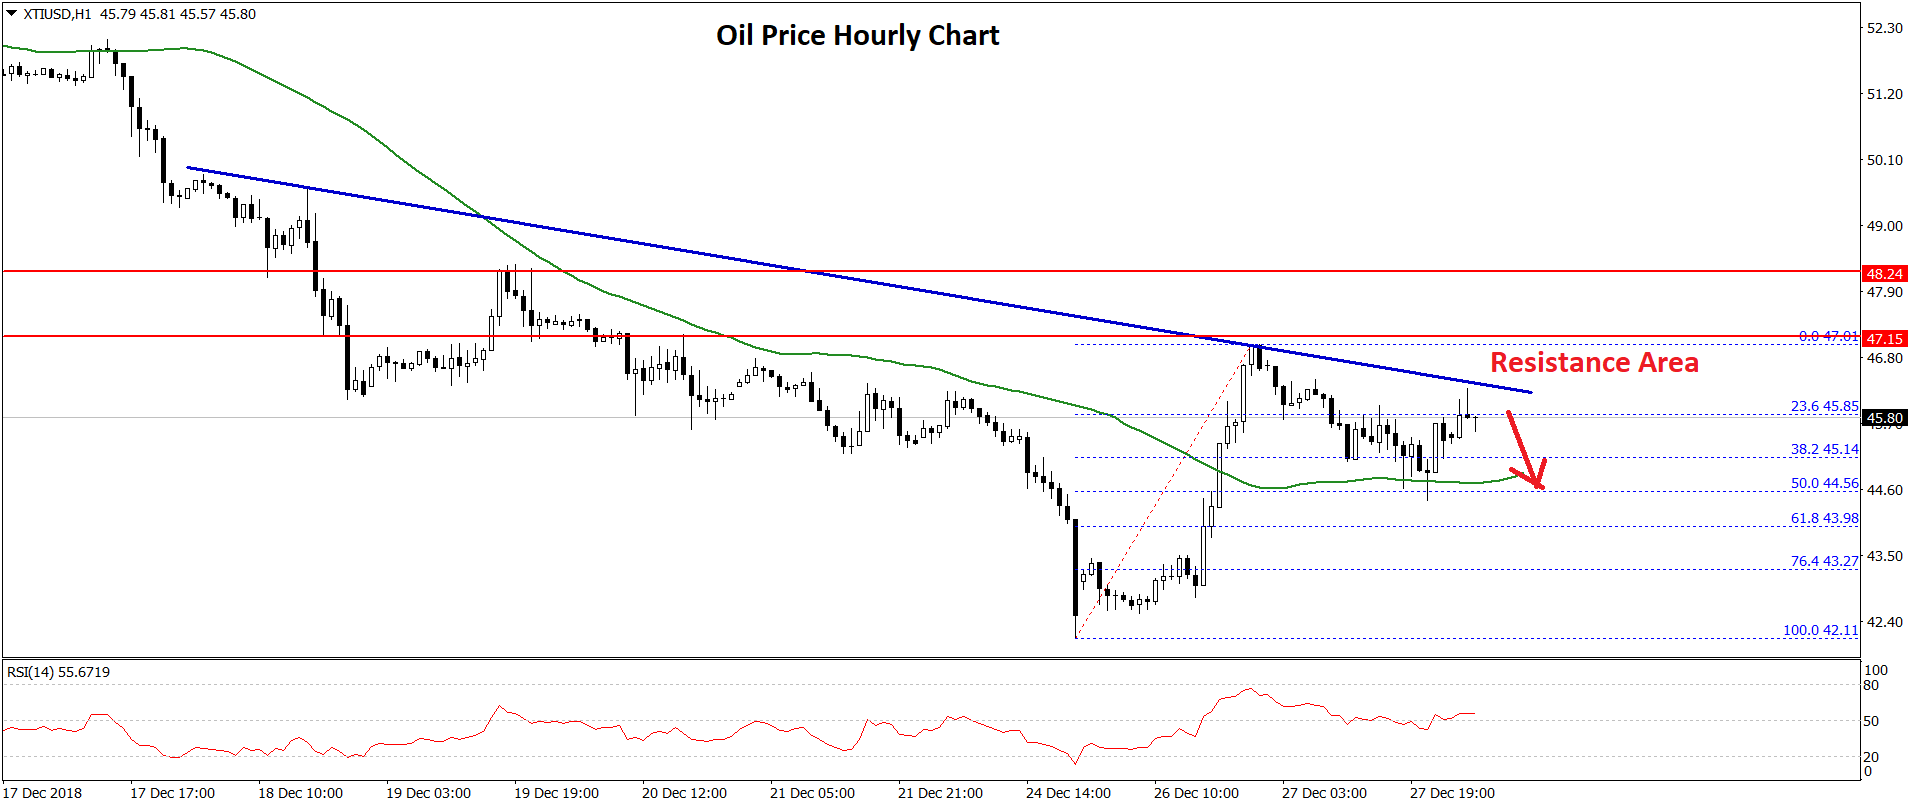
The price is moving lower and it already broke the $45.00 support plus the 38.2% Fib retracement level of the recent wave from the $42.11 low to $47.01 high. If the price continues to move down, there could be more losses below the $43.00 support.
An intermediate support is near the $43.20 and the 76.4% Fib retracement level of the recent wave from the $42.11 low to $47.01 high. Any further losses are likely to lead the price towards the $42.00 and $40.00 levels.
The overall market sentiment is still bearish for crude oil and it seems like there could be a downside extension below the $44.00 and $43.00 support levels. On the upside, the main barrier for buyers is near the $46.00 and $47.00 levels, above which there could be the start of an upward move.
Trade over 50 forex markets 24 hours a day with FXOpen. Take advantage of low commissions, deep liquidity, and spreads from 0.0 pips (additional fees may apply). Open your FXOpen account now or learn more about trading forex with FXOpen.
This article represents the opinion of the Companies operating under the FXOpen brand only. It is not to be construed as an offer, solicitation, or recommendation with respect to products and services provided by the Companies operating under the FXOpen brand, nor is it to be considered financial advice.
Stay ahead of the market!
Subscribe now to our mailing list and receive the latest market news and insights delivered directly to your inbox.


Latest articles

Meta: V-Shaped Recovery Meets Heavy Volume Resistance
The movement in Meta Platforms shares is being driven by two competing narratives. On one hand, advertising revenue is benefiting from AI-based tools: the Advantage+ platform continues to support strong advertiser demand, and the analyst consensus for Q1 2026 revenue

Commodity Currencies Test Key Levels Ahead of Major Macro Data
Commodity-linked currencies are trading near key levels, showing restrained price action as market participants adopt a wait-and-see approach. The fundamental backdrop is shaped by expectations surrounding the release of Australia’s inflation data and the Bank of Canada’s interest

Microsoft Shares Two Days Ahead of Earnings Release
In January, Microsoft shares came under pressure following the company’s earnings report. Although both revenue and earnings per share exceeded analysts’ expectations, growth in the Azure cloud platform slowed to 39% year-on-year from 40% in the previous quarter—enough