


FXOpen

Gold price is rising steadily and it is trading above the $1,600 resistance. Conversely, crude oil price rallied towards $28.00 and recently corrected more than 40% gains.
Important Takeaways for Gold and Oil
- Gold price formed a strong support above $1,570 and recovered higher against the US Dollar.
- There is a major contracting triangle forming with resistance near $1,615 on the hourly chart of gold.
- Crude oil price rallied towards the $28.00 and $28.50 resistances before correcting lower.
- There was a break above a key bearish trend line with resistance near $22.85 on the hourly chart of XTI/USD.
Gold Price Technical Analysis
Earlier this week, gold price declined from well above the $1,600 level against the US Dollar. It traded below the $1,580 support area, but the $1,570 zone acted as a strong support.
A swing low is formed near $1,567 on FXOpen and the price formed a decent base above the $1,570 level. As a result, the price started a fresh increase above the $1,580 and $1,600 resistance levels.
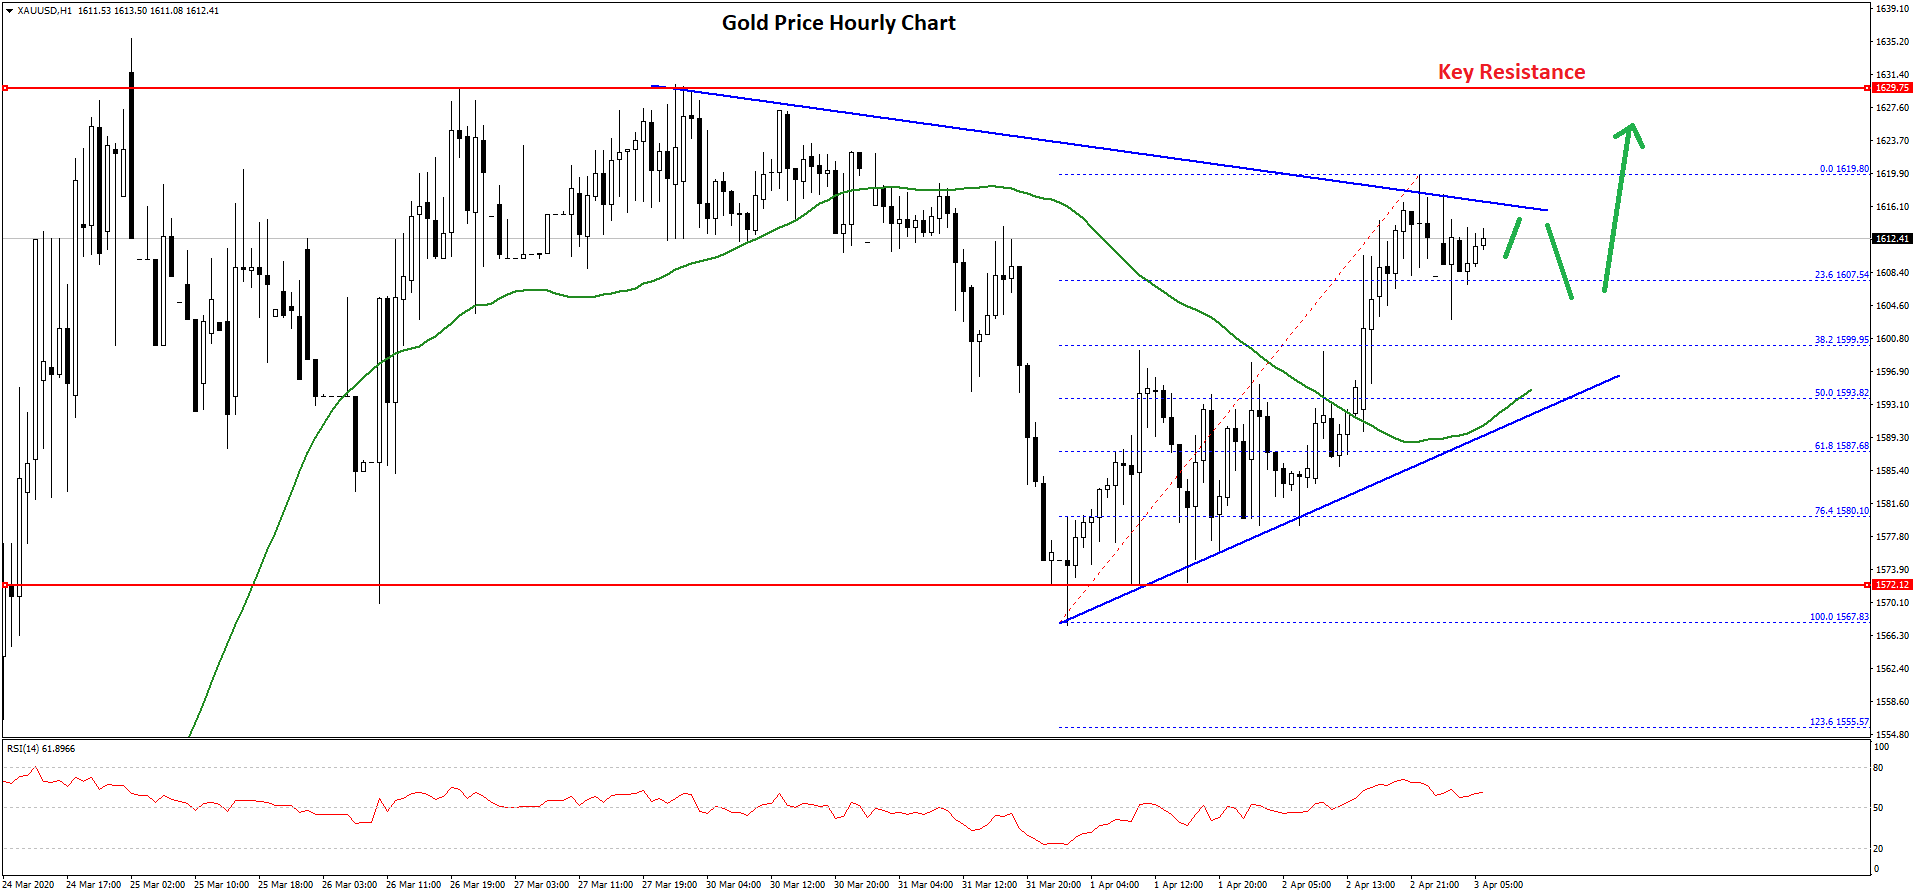
The bulls remained in action and the price even climbed above the $1,610 level and the 50 hourly simple moving average. Finally, the price climbed towards $1,620 and traded as high as $1,619.
It is currently consolidating gains below $1,620. An initial support is near the 23.6% Fib retracement level of the recent wave from the $1,567 low to $1,619 high.
The first major support is near the $1,600 level, followed by $1,595. The 50% Fib retracement level of the recent wave from the $1,567 low to $1,619 high is also near the $1,595 level along with the 50 hourly simple moving average.
Any further losses may perhaps push the price back into a bearish zone towards the $1,570 support. At the outset, there is a major contracting triangle forming with resistance near $1,615 on the hourly chart of gold.
If there is an upside break above the triangle resistance, the price could test the main $1,630 resistance area. Any further gains could lead the price towards the $1,645 level in the near term.
Oil Price Technical Analysis
Recently, crude oil price formed a strong support base above the $22.00 level against the US Dollar. The price started a nasty upward move and broke many hurdles near the $25.00 resistance.
It even climbed above the $26.50 level and settled well above the 50 hourly simple moving average. More importantly, there was a break above a key bearish trend line with resistance near $22.85 on the hourly chart of XTI/USD.
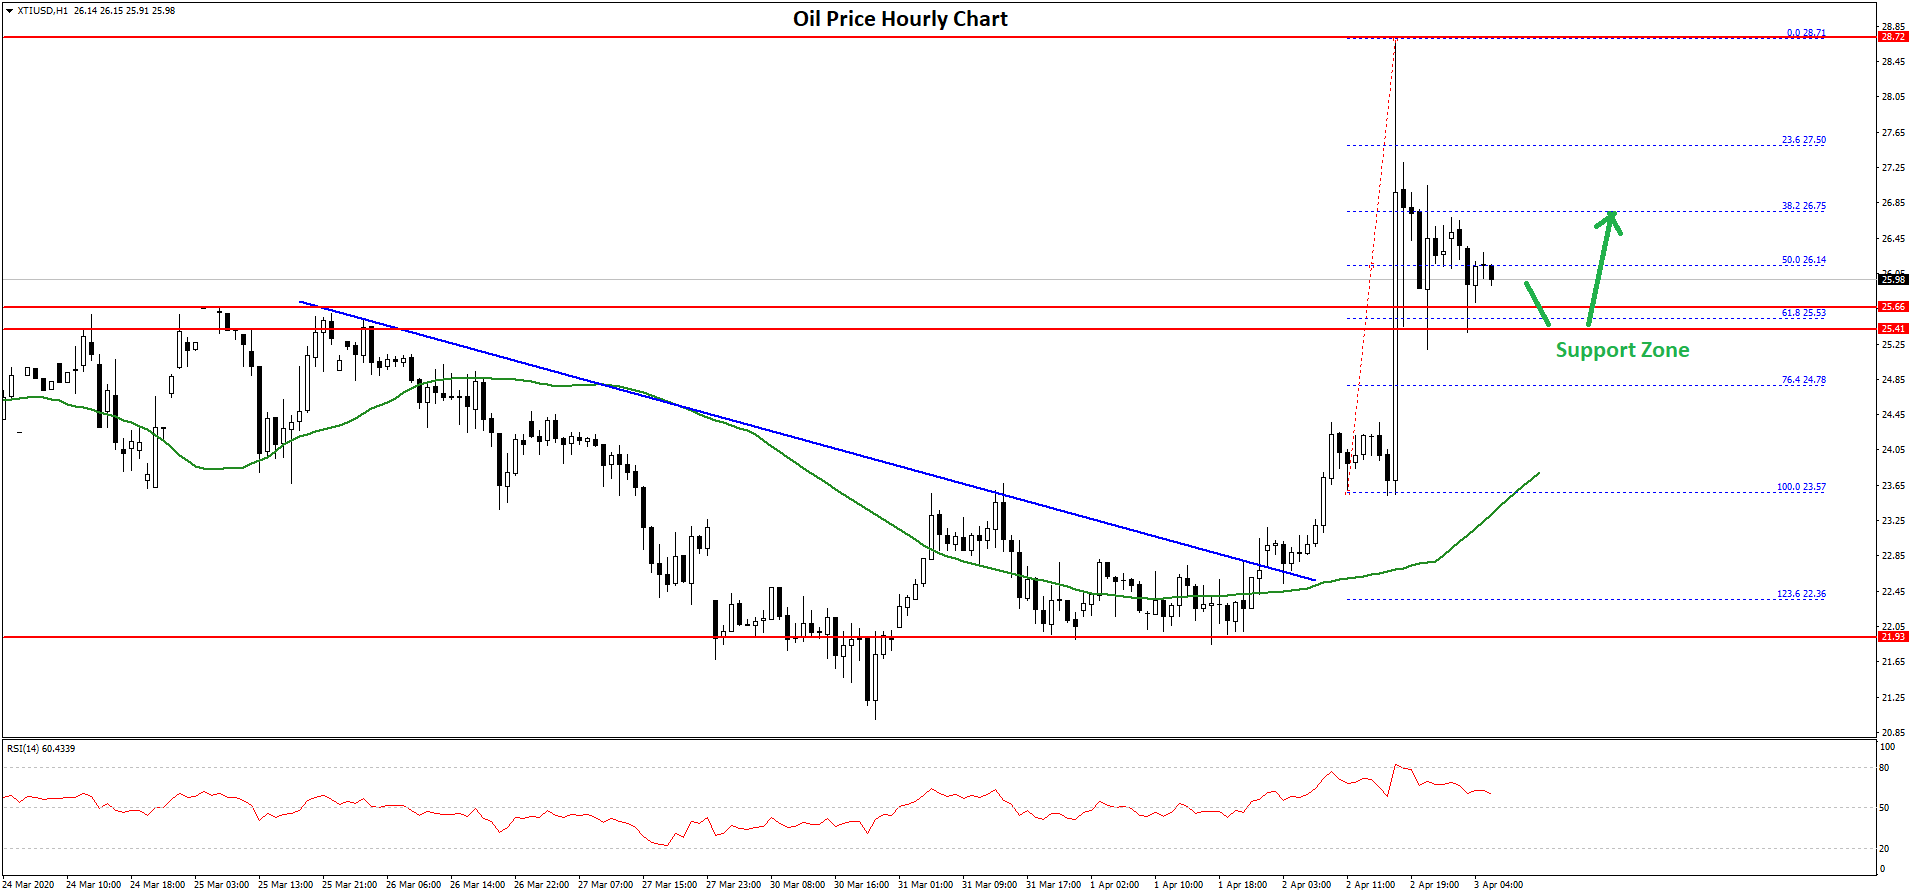
Finally, the price surged towards the $28.00 and $28.50 resistance levels. It traded as high as $28.71 and recently corrected lower. There was a break below the $27.50 and $26.80 levels.
Besides, the price spiked below the 50% Fib retracement level of the recent surge from the $23.57 low to $28.71 high. On the downside, the $25.50 area is acting as a strong support (the previous breakout zone).
The 61.8% Fib retracement level of the recent surge from the $23.57 low to $28.71 high is also near the $25.50 level. If the price fails to stay above the $25.50 support, it could decline back towards the $24.00 level and the 50 hourly SMA.
Conversely, the price could resume its upward move and climb higher towards the $28.00 resistance area in the near term.
Trade over 50 forex markets 24 hours a day with FXOpen. Take advantage of low commissions, deep liquidity, and spreads from 0.0 pips. Open your FXOpen account now or learn more about trading forex with FXOpen.
This article represents the opinion of the Companies operating under the FXOpen brand only. It is not to be construed as an offer, solicitation, or recommendation with respect to products and services provided by the Companies operating under the FXOpen brand, nor is it to be considered financial advice.
Stay ahead of the market!
Subscribe now to our mailing list and receive the latest market news and insights delivered directly to your inbox.


Latest articles

Sterling Consolidates Ahead of the Bank of England Decision
Sterling is consolidating as markets await the Bank of England’s interest rate decision, while investors’ attention is gradually turning to tomorrow’s meeting of the Bank of Japan. The UK currency is moving cautiously, as markets have largely priced

Analysis of the Volatility Spike on the BTC/USD Chart
Yesterday, the BTC/USD chart saw sharp price swings during the US trading session:
→ first, Bitcoin rose by more than 3%;
→ shortly afterwards, it dropped by over 4%.
The main impulses unfolded within just a few hours and triggered liquidations

The US Dollar Index (DXY) Rebounds from a Two-Month Low
A week ago, we:
→ updated a system of two trend channels;
→ identified signs of selling pressure dominance;
→ outlined a scenario in which price could slide towards the lower boundary of the blue channel, potentially acting as key support.
As the