


Analysis of the Volatility Spike on the BTC/USD Chart
FXOpen

Yesterday, the BTC/USD chart saw sharp price swings during the US trading session:
→ first, Bitcoin rose by more than 3%;
→ shortly afterwards, it dropped by over 4%.
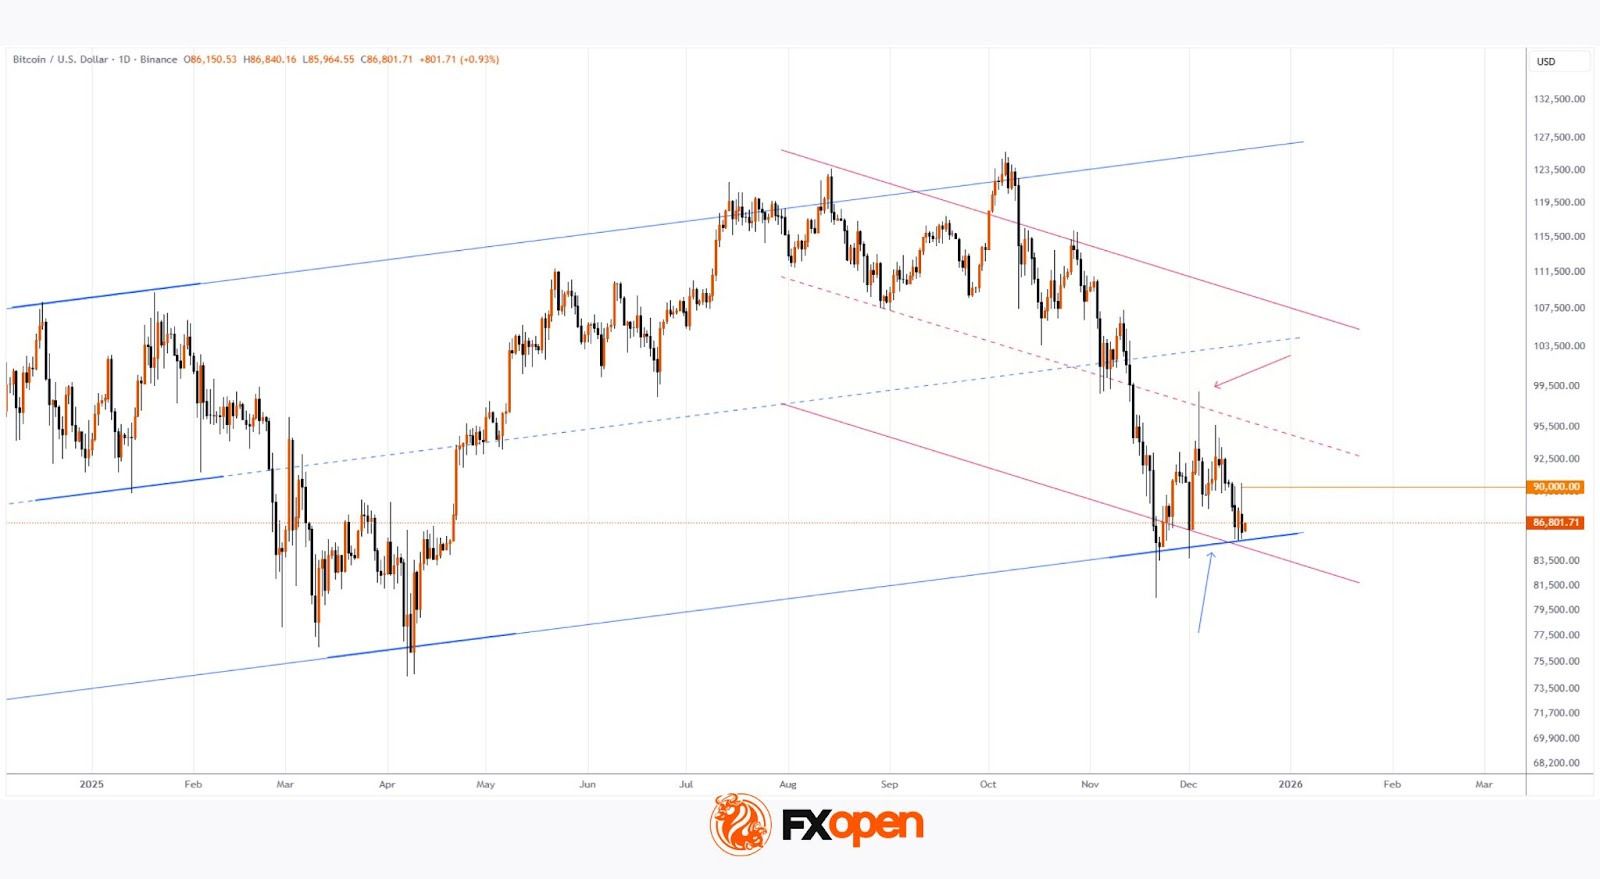
The main impulses unfolded within just a few hours and triggered liquidations on both long and short positions. In total, around $450 million worth of positions were liquidated across Binance and other crypto exchanges. As a result, on the daily BTC/USD chart, yesterday’s candle resembles a pin bar with a long upper wick, which is typically viewed as a bearish signal.
Notably, it is difficult to identify clear fundamental drivers for the crypto market at this time, aside from growing rumours about a potential military conflict between Venezuela and the United States.
However, looking at the broader, long-term context of the BTC/USD chart provides important clues as to what this price action may signify.
Technical Analysis of the BTC/USD Chart
When a long-term ascending channel is plotted (shown in blue), it becomes clear that Bitcoin’s price is trading near its lower boundary, which has been acting as support since mid-November (marked by the blue arrow).
At the same time, at the peak of yesterday’s rally, the price made a false bullish break above the psychological $90,000 level, as well as above the high of the bearish candle from 15 December. This allows the move to be interpreted as a bearish liquidity grab.
Taken together, these factors suggest that so-called “smart money” is applying increasing pressure on the lower boundary of the blue channel.
Therefore, traders may wish to consider a scenario in which Bitcoin develops further bearish momentum within a descending channel. This channel was first outlined in an analytical note a month ago, has since been extended lower, and its median line has acted as resistance (highlighted by the red arrow), confirming the relevance of this structure.
FXOpen offers the world's most popular cryptocurrency CFDs*, including Bitcoin and Ethereum. Floating spreads, 1:2 leverage — at your service (additional fees may apply). Open your trading account now or learn more about crypto CFD trading with FXOpen.
*Important: At FXOpen UK, Cryptocurrency trading via CFDs is only available to our Professional clients. They are not available for trading by Retail clients. To find out more information about how this may affect you, please get in touch with our team.
This article represents the opinion of the Companies operating under the FXOpen brand only. It is not to be construed as an offer, solicitation, or recommendation with respect to products and services provided by the Companies operating under the FXOpen brand, nor is it to be considered financial advice.
Stay ahead of the market!
Subscribe now to our mailing list and receive the latest market news and insights delivered directly to your inbox.


Latest articles

CAD/JPY: The Yen's Most Historic Move in 30 Years Meets a Fragile Support
Two central banks are heading in genuinely opposite directions this week, and the tension is unmistakable. The Bank of Canada held rates steady at 2.25% on September 2, with a mildly hawkish tilt as policymakers acknowledged a broadening economic

USD/JPY and USD/CAD Await Key Fed Decision
The US dollar is consolidating against the yen and Canadian dollar ahead of the key event of the week — the Federal Reserve meeting. The Fed is widely expected to raise its policy rate by 25 basis points to a range

UnitedHealth: Fundamentals Are Healing, Now the Chart Must Agree
UnitedHealth finds itself in a genuinely split narrative right now, trading near $388, down about 15.9% from its 52-week high, even as the fundamental picture keeps improving. Q2 earnings beat expectations, with revenue of $112.03 billion, and the