


FXOpen

Gold price climbed higher sharply from the $1,400 support area and is currently correcting lower. Conversely, crude oil price is under pressure and is facing hurdles.
Important Takeaways for Gold and Oil
- Gold price climbed higher sharply from the $1,400 support area to $1,445 against the US Dollar.
- There was a break above a short term declining channel with resistance near $1,408 on the hourly chart of gold.
- Crude oil price started a major decline and broke the key $55.75 support area.
- There is a crucial bearish trend line forming with resistance near $56.20 on the hourly chart of XTI/USD.
Gold Price Technical Analysis
Earlier this week, gold price declined below the $1,420 support against the US Dollar. The price even broke the $1,412 support level and tested the $1,400 support, where the bulls took a stand.
A swing low was formed near $1,400 on FXOpen and the price started a solid upward move. It broke many resistances near the $1,410 level. Moreover, there was a break above a short term declining channel with resistance near $1,408 on the hourly chart of gold.
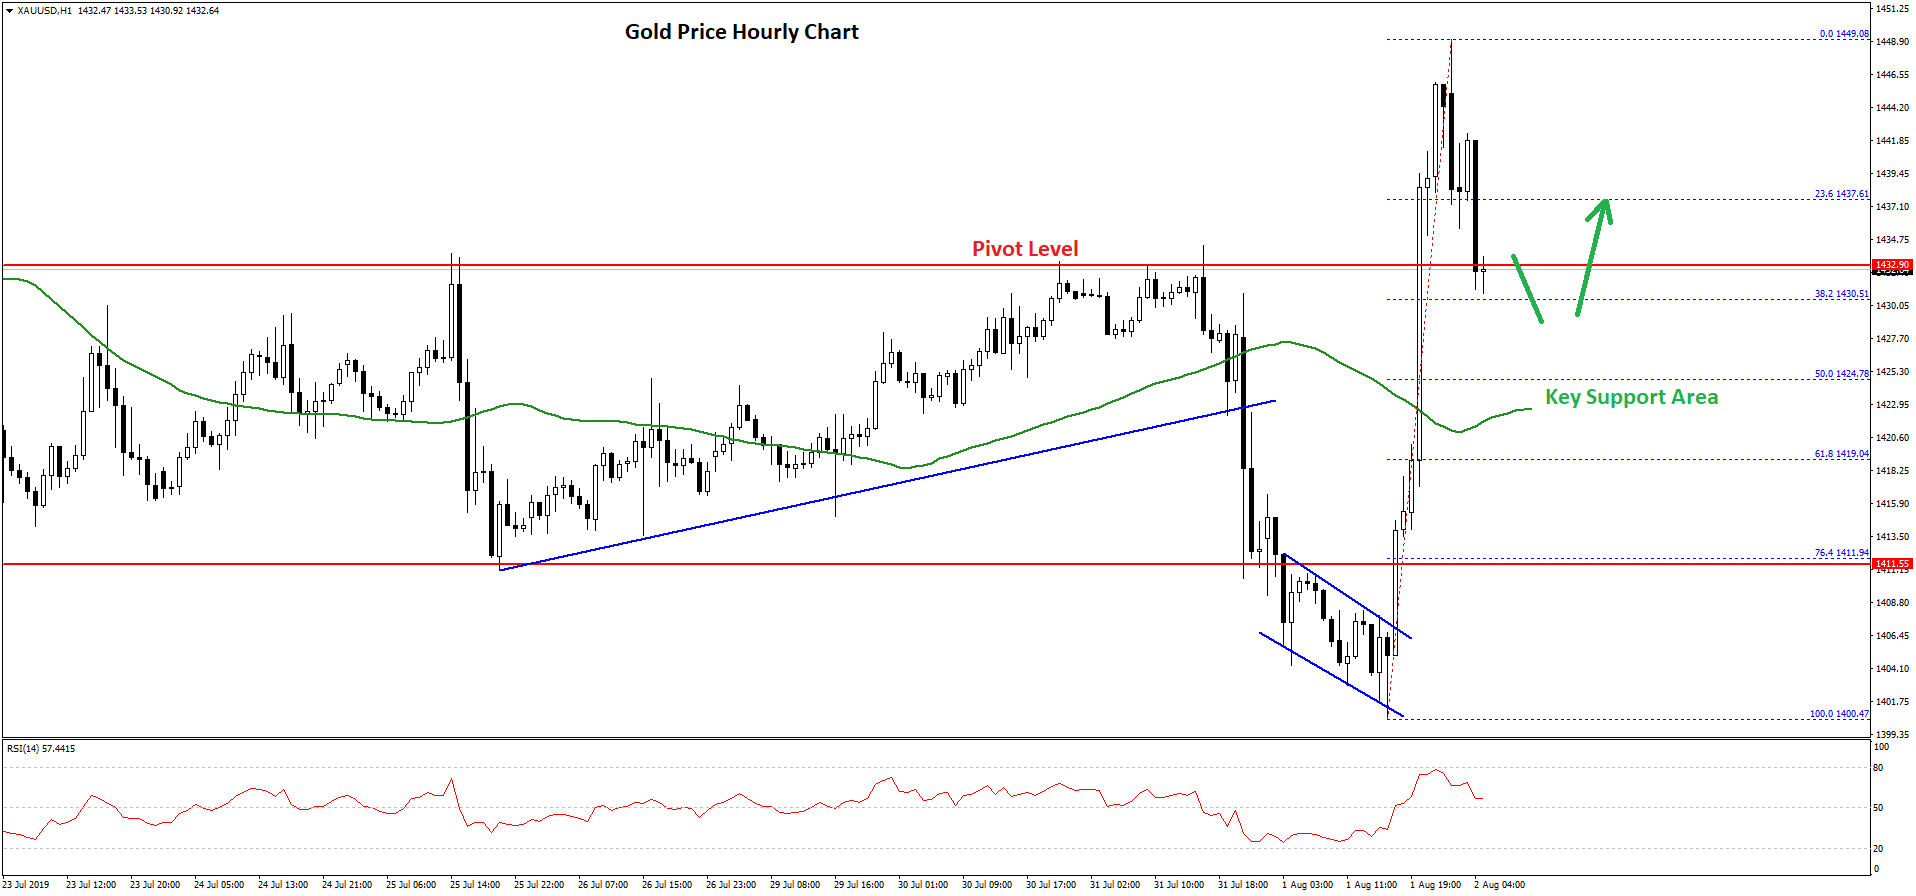
The price rallied above the $1,430 resistance and the 50 hourly simple moving average. A swing high was formed near $1,449 and the price is currently correcting lower.
It broke the $1,440 level plus the 23.6% Fib retracement level of the upward move from the $1,400 low to $1,449 high. The price is now trading near the key $1,430-$1,432 support level.
If there are more downside, the price could test the next important support at $1,425. The 50% Fib retracement level of the upward move from the $1,400 low to $1,449 high is also near the $1,424 level.
On the upside, an initial resistance is near the $1,438 level. If the price starts a fresh increase above the $1,438 and $1,440 resistance levels, there are high chances of more gains above the $1,445 level.
Oil Price Technical Analysis
After a decent upward move, crude oil price failed to gain momentum above the $58.80 level against the US Dollar. The price topped near the $58.79 level and recently declined heavily.
It broke the $58.00 and $57.50 support levels to enter a bearish zone. Moreover, there was a break below a connecting bullish trend line on the hourly chart, $57.00, and the 50 hourly simple moving average.
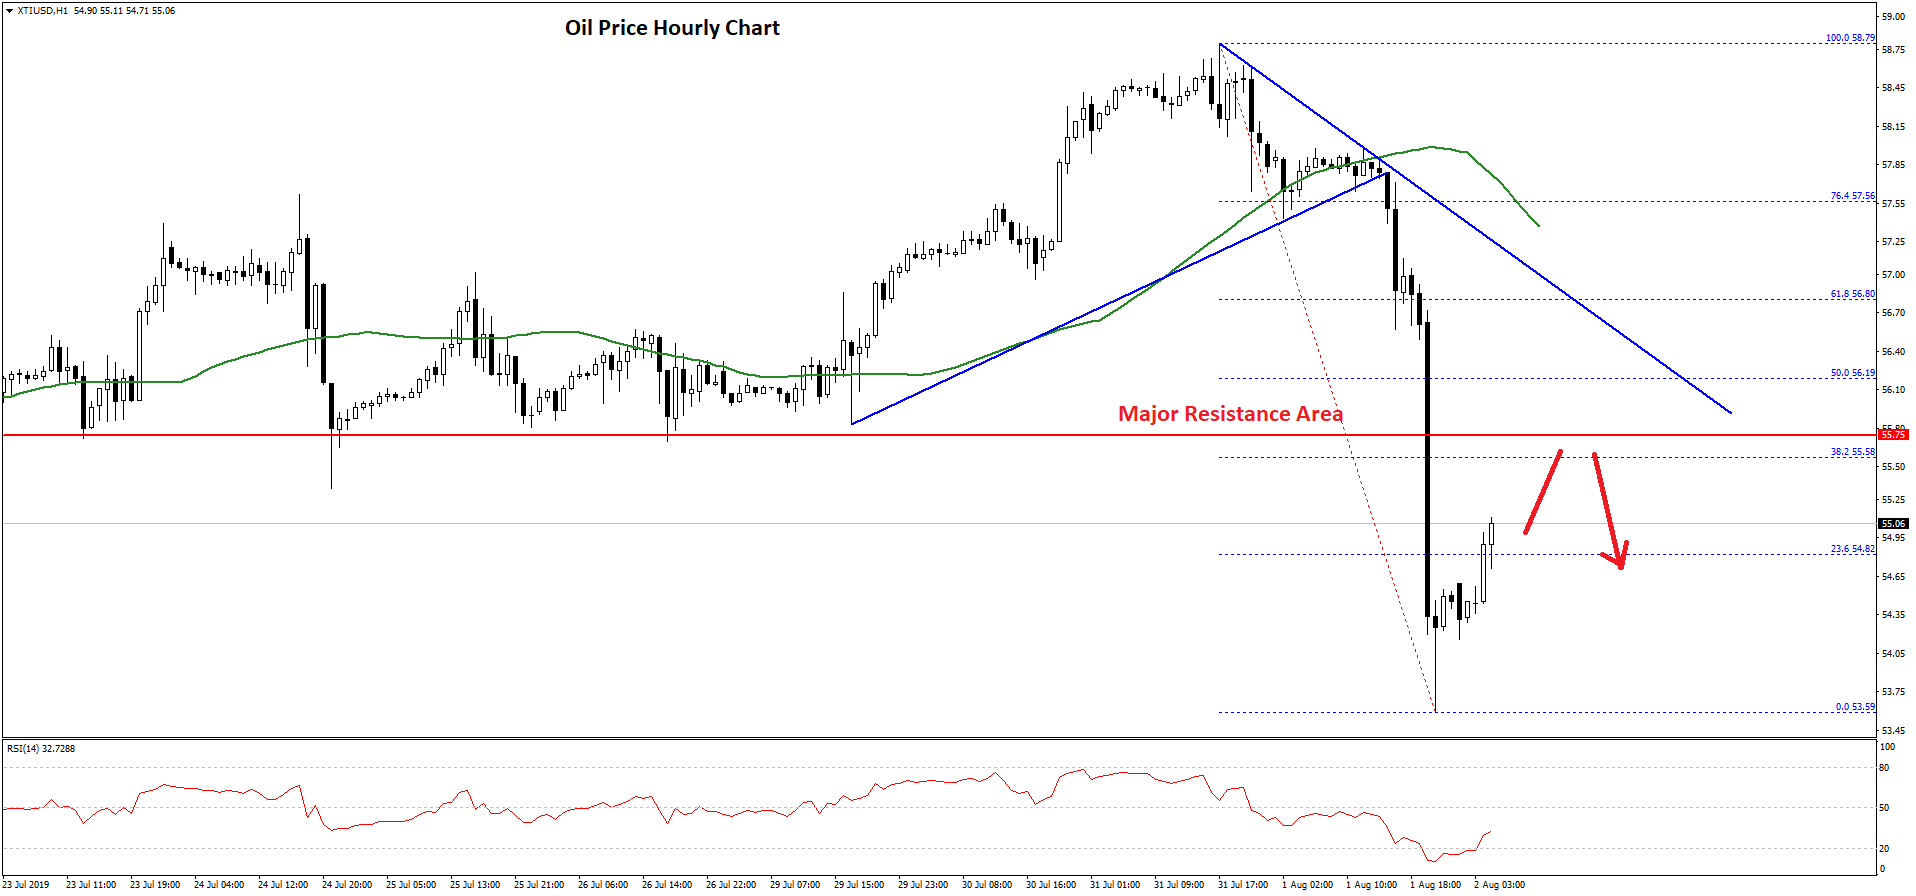
Finally, the price broke the key $55.75 support level and declined towards the $53.50 level. A swing low was formed near $53.59 and the price is currently correcting higher.
It broke the $54.50 level plus the 23.6% Fib retracement level of the recent decline from the $58.79 high to $53.59 low. However, there are many hurdles on the upside near the $55.75 and $56.00 levels.
The main resistance is near $55.75, which was a support earlier. There is also a crucial bearish trend line forming with resistance near $56.20 on the hourly chart of XTI/USD.
The 50% Fib retracement level of the recent decline from the $58.79 high to $53.59 low is also near the $56.19 level to act as a strong resistance. A successful close above the $56.20 level is needed for a fresh increase.
On the downside, an immediate support is near the $54.50 level. If there are more losses, the price may revisit the $54.00 support level in the coming sessions.
Trade over 50 forex markets 24 hours a day with FXOpen. Take advantage of low commissions, deep liquidity, and spreads from 0.0 pips. Open your FXOpen account now or learn more about trading forex with FXOpen.
This article represents the opinion of the Companies operating under the FXOpen brand only. It is not to be construed as an offer, solicitation, or recommendation with respect to products and services provided by the Companies operating under the FXOpen brand, nor is it to be considered financial advice.
Stay ahead of the market!
Subscribe now to our mailing list and receive the latest market news and insights delivered directly to your inbox.


Latest articles

Sterling Consolidates Ahead of the Bank of England Decision
Sterling is consolidating as markets await the Bank of England’s interest rate decision, while investors’ attention is gradually turning to tomorrow’s meeting of the Bank of Japan. The UK currency is moving cautiously, as markets have largely priced

Analysis of the Volatility Spike on the BTC/USD Chart
Yesterday, the BTC/USD chart saw sharp price swings during the US trading session:
→ first, Bitcoin rose by more than 3%;
→ shortly afterwards, it dropped by over 4%.
The main impulses unfolded within just a few hours and triggered liquidations

The US Dollar Index (DXY) Rebounds from a Two-Month Low
A week ago, we:
→ updated a system of two trend channels;
→ identified signs of selling pressure dominance;
→ outlined a scenario in which price could slide towards the lower boundary of the blue channel, potentially acting as key support.
As the