


FXOpen

Gold price started a strong decline after trading close to $2,075. Crude oil price is currently consolidating in a range and preparing for the next key break.
Important Takeaways for Gold and Oil
- Gold price traded to a new all-time high above $2,070 before correcting lower against the US Dollar.
- There is a key bearish trend line forming with resistance near $1,970 on the hourly chart of gold.
- Crude oil price is currently trading nicely above the $42.00 support zone.
- There is a major bullish trend line forming with support near $42.30 on the hourly chart of XTI/USD.
Gold Price Technical Analysis
Gold price extended its rise above the $2,000 level against the US Dollar. The price even broke the $2,050 level and traded to a new multi-year high above $2,070 on FXOpen.
Recently, there was a sharp downside correction below the $2,050 and $2,000 support levels. The price declined more than $1,000 and even dived below the $1,900 level, plus the 50 hourly simple moving average.
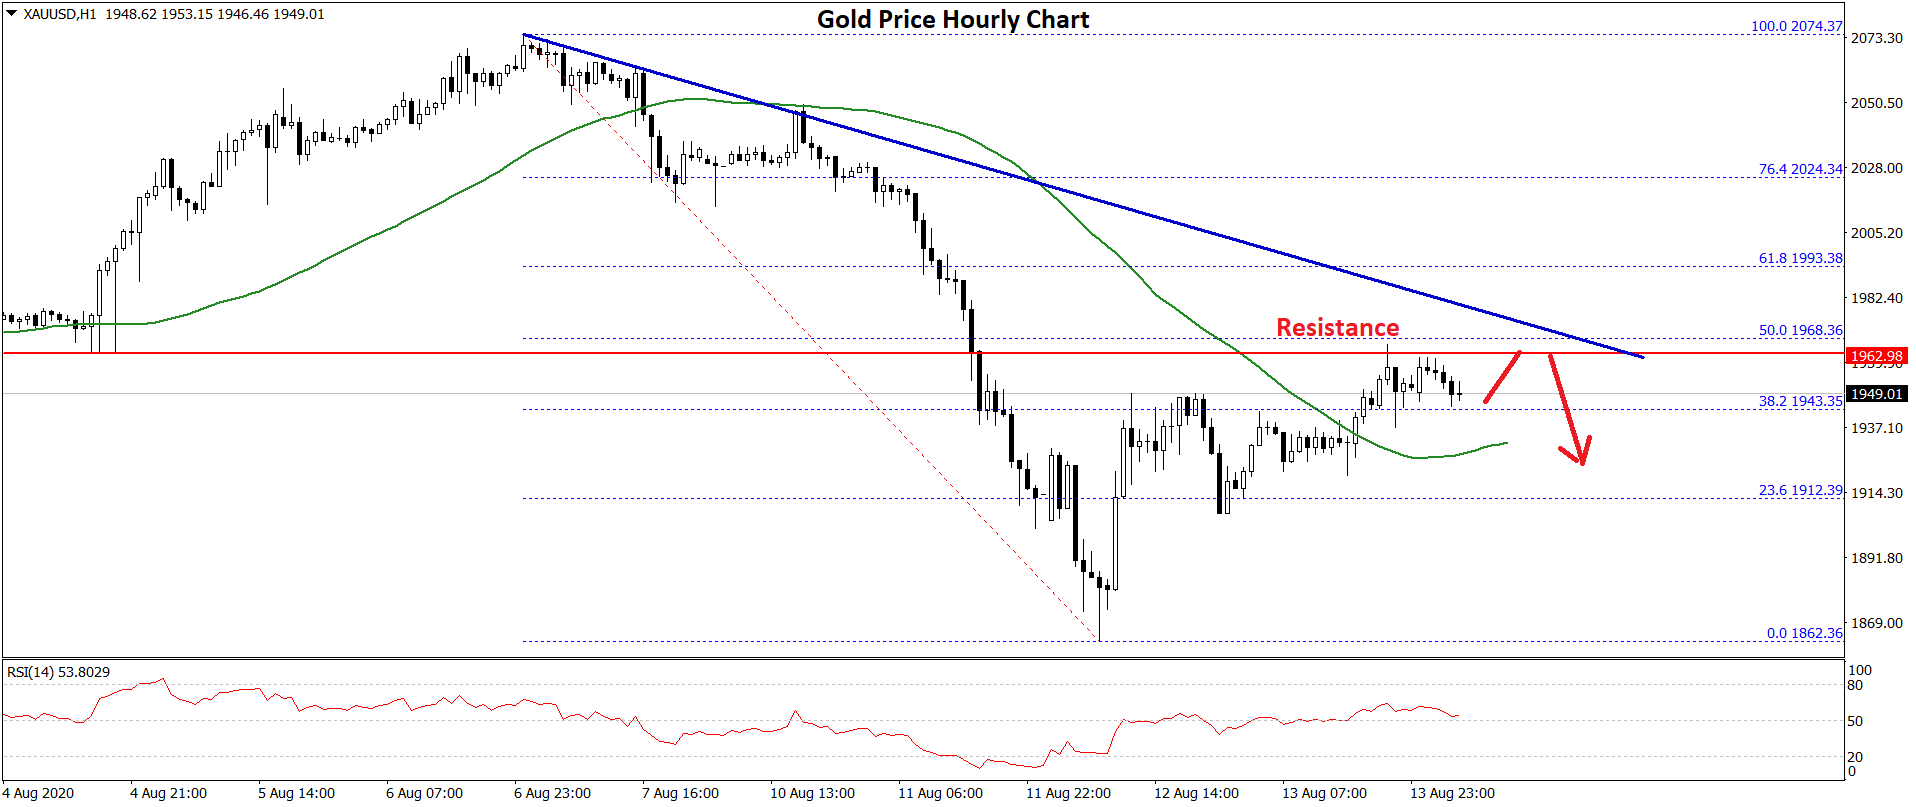
It traded as low as $1,862 and currently correcting higher. There was a break above the $1,900 and $1,920 levels. Besides, the price climbed above the 23.6% Fib retracement level of the recent dive from the $2,074 high to $1,862 low.
The price traded above the $1,950 level, but it is struggling to clear the $1,965 and $1,970 levels. There is also a key bearish trend line forming with resistance near $1,970 on the hourly chart of gold.
The trend line is close to the 50% Fib retracement level of the recent dive from the $2,074 high to $1,862 low. To start a fresh increase, gold price must clear the $1,965 and $1,970 resistance levels. In the mentioned case, it could revisit the $2,000 level.
Conversely, it might start a fresh decline below the $1,940 level and the 50 hourly SMA. The next major support is near the $1,920 level, below which the price might revisit the $1,900 support zone in the coming sessions.
Oil Price Technical Analysis
Crude oil price started a steady rise above the $40.50 and $41.20 levels against the US Dollar. The price even broke the $42.00 resistance zone to move into a positive zone.
It traded as high as $43.11 recently and settled above the 50 hourly simple moving average. At the moment, the price is consolidating gains and trading in a range below the $43.00 level.
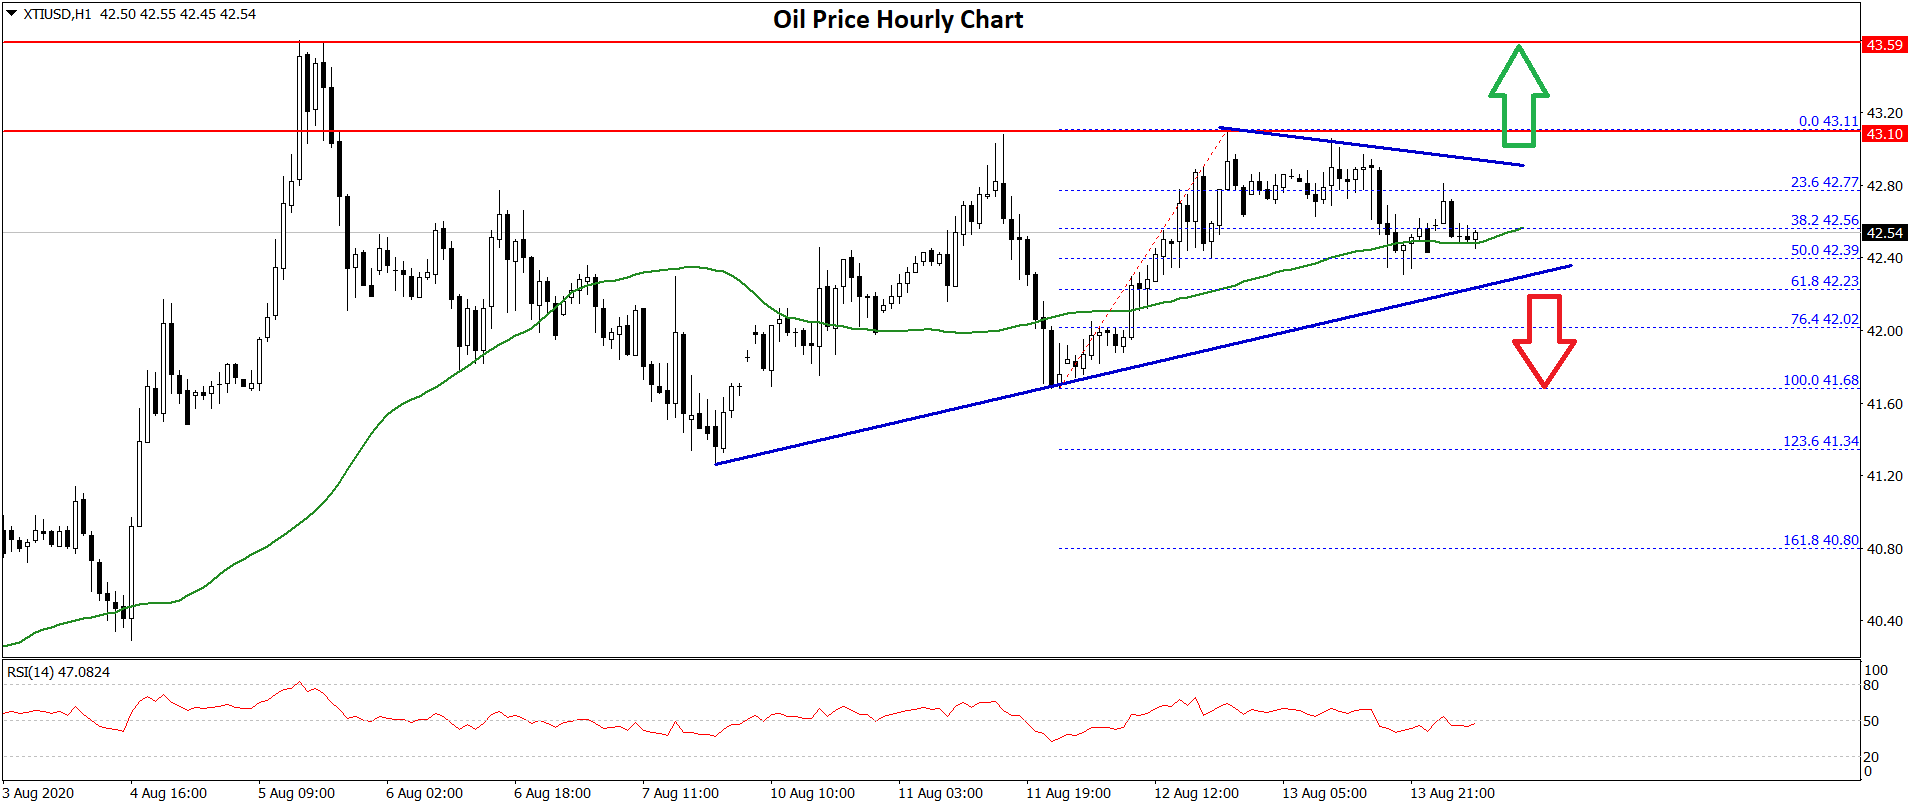
It seems like there is a major bullish trend line forming with support near $42.30 on the hourly chart of XTI/USD. If the price breaks the trend line support, it could decline below the $42.00 support zone.
The next major support is near the $41.65 level, below which the price is likely to continue lower towards the $40.50 level in the coming sessions. Any further losses could lead it towards the $40.00 pivot level.
Conversely, oil price might continue to rise above the $43.00 and $43.10 levels. The next major hurdle for the bulls could be $43.60, above which there are chances of a sharp rise. In the mentioned case, the bulls are likely to aim a test of the main $45.00 resistance in the near term.
Trade over 50 forex markets 24 hours a day with FXOpen. Take advantage of low commissions, deep liquidity, and spreads from 0.0 pips. Open your FXOpen account now or learn more about trading forex with FXOpen.
This article represents the opinion of the Companies operating under the FXOpen brand only. It is not to be construed as an offer, solicitation, or recommendation with respect to products and services provided by the Companies operating under the FXOpen brand, nor is it to be considered financial advice.
Stay ahead of the market!
Subscribe now to our mailing list and receive the latest market news and insights delivered directly to your inbox.


Latest articles

S&P 500 Index: Chart Analysis After Friday’s Sell-Off
Trading on 12 December was overshadowed by a sharp decline in the S&P 500 (US SPX 500 mini on FXOpen), with the session low approaching December’s previous trough.
Among the key fundamental drivers behind Friday’s drop

Market Analysis: AUD/USD and NZD/USD Test Support, Break or Bounce Next?
AUD/USD is attempting a fresh increase from 0.6630. NZD/USD is consolidating and could aim for a move above 0.5800 in the short term.
Important Takeaways for AUD/USD and NZD/USD Analysis Today
· The Aussie Dollar

USD/JPY Slides Towards Key Support
A Bank of Japan monetary policy meeting is due this week, and expectations around the decision are supporting the yen today. Traders increasingly believe that the central bank may raise its policy rate by 25 basis points to 0.75%