


Gold Price Gains Momentum While Crude Oil Price Faces Hurdle
FXOpen

Gold price is trading in a positive zone above the $1,825 support. Crude oil price is facing hurdles near $82.20 and $83.00.
Important Takeaways for Gold and Oil
· Gold price started a decent increase above the $1,820 resistance against the US Dollar.
· There is a key bullish trend line forming with support near $1,842 on the hourly chart of gold.
· Crude oil price is struggling to gain pace for a move above the $82.20 level.
· There was a break below a major bullish trend line with support near $81.65 on the hourly chart of XTI/USD.
Gold Price Technical Analysis
Gold price started a fresh increase above the $1,800 pivot level against the US Dollar. The price gained pace and it was able to settle above the $1,820 resistance zone.
The price even settled above the $1,820 level and the 50 hourly simple moving average. Finally, there was a break above the $1,850 level. A high was formed near $1,867 on FXOpen and the price corrected lower. There was a break below the $1,860 level and the $1,855 support.
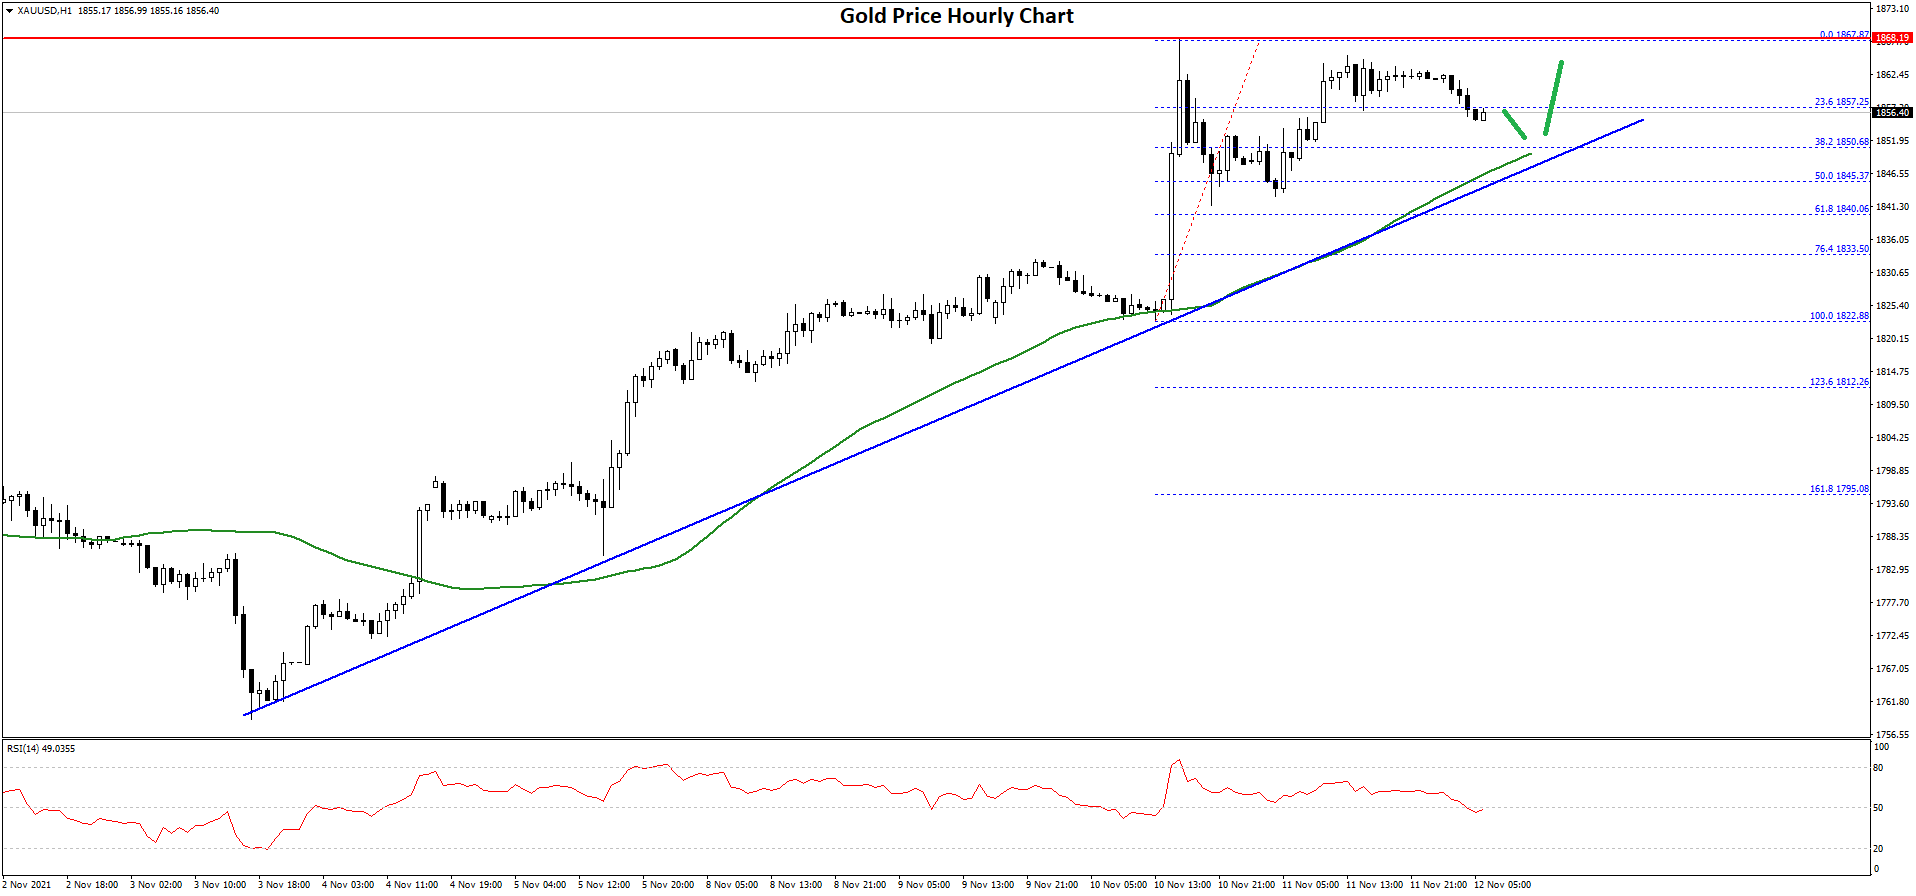
The price even traded below the 50% Fib retracement level of the upward move from the $1,822 swing low to $1,867 high.
However, the bulls remained active near $1,842. The price is also stable above the 61.8% Fib retracement level of the upward move from the $1,822 swing low to $1,867 high. Besides, there is a key bullish trend line forming with support near $1,842 on the hourly chart of gold.
The price is back above the $1,855 level and the 50 hourly simple moving average. An immediate resistance on the upside is near the $1,862 level.
The main resistance is near the $1,870 level. A close above the $1,870 level could open the doors for a steady increase towards $1,885. The next major resistance sits near the $1,900 level. On the downside, an initial support is near the $1,855 level.
The first major support is near the $1,850 level. A downside break below the $1,850 support zone may possibly spark a steady decline. In the stated case, the price could test the $1,820 support.
Oil Price Technical Analysis
Crude oil price started a steady increase from the $78.00 support zone against the US Dollar. The price broke the $80.00 resistance zone to move into a positive zone.
The price even cleared the $82.00 level and settled above the 50 hourly simple moving average. However, the price failed to gain pace for a move above the $83.50 zone. A high was formed near $83.55 before the price corrected lower.
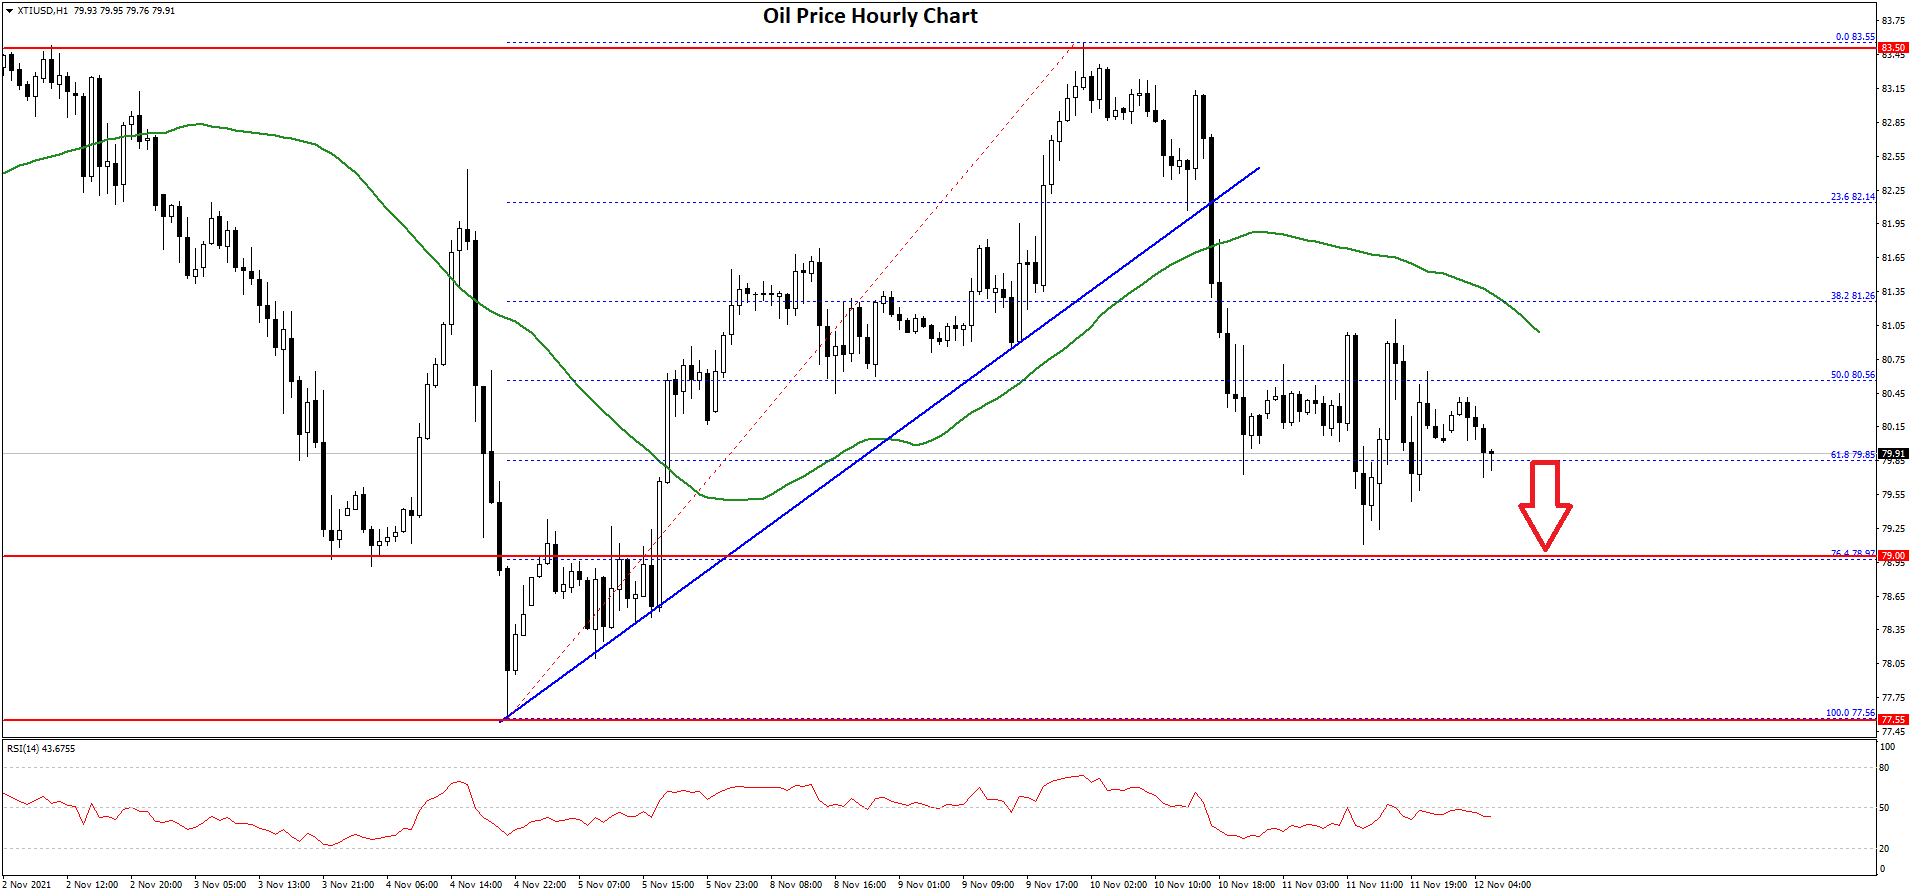
It corrected a few points below the $82.00 level. The price even traded below the 50% Fib retracement level of the upward move from the $77.60 swing low to $83.55 high.
There was also a break below a major bullish trend line with support near $81.65 on the hourly chart of XTI/USD. Finally, there was a spike below $79.50 level. However, the price stayed above the $79.00 level.
On the upside, the price is facing resistance near the $81.80 level. The next key resistance is near the $82.20 level, above which the price might accelerate higher towards $83.50.
On the downside, an initial support is near the $79.50 level. The first key support is near the $79.00 level, below which there is a risk of a larger decline. The next major support sits near the $77.50 level.
This forecast represents FXOpen Markets Limited opinion only, it should not be construed as an offer, invitation or recommendation in respect to FXOpen Markets Limited products and services or as financial advice.
This article represents the opinion of the Companies operating under the FXOpen brand only. It is not to be construed as an offer, solicitation, or recommendation with respect to products and services provided by the Companies operating under the FXOpen brand, nor is it to be considered financial advice.
Stay ahead of the market!
Subscribe now to our mailing list and receive the latest market news and insights delivered directly to your inbox.

Latest articles

NZD/CHF Analysis: Which Currency Breaks the Consolidation First?
NZD/CHF remains locked in a tight range as traders await the next monetary policy catalyst.
The Reserve Bank of New Zealand heads into Wednesday's meeting on shaky ground. After May's 3-3 split was resolved by a casting vote, the

S&P 500: Index Narrows Its Range as the Labour Market Cools
The broad US market index, the S&P 500, has entered July against a backdrop of mixed signals from the labour market. The Bureau of Labor Statistics report released on 2 July showed that just 57,000 jobs were

Ethereum: Has the Recovery Begun?
Ethereum has staged a notable rebound after once again testing the heavily watched psychological zone around 1500$. Since bouncing off this support, ETH/USD has climbed roughly 13%, now trading around the $1,700 mark.
This recovery is being driven