


Gold Price Prospects for H2
FXOpen

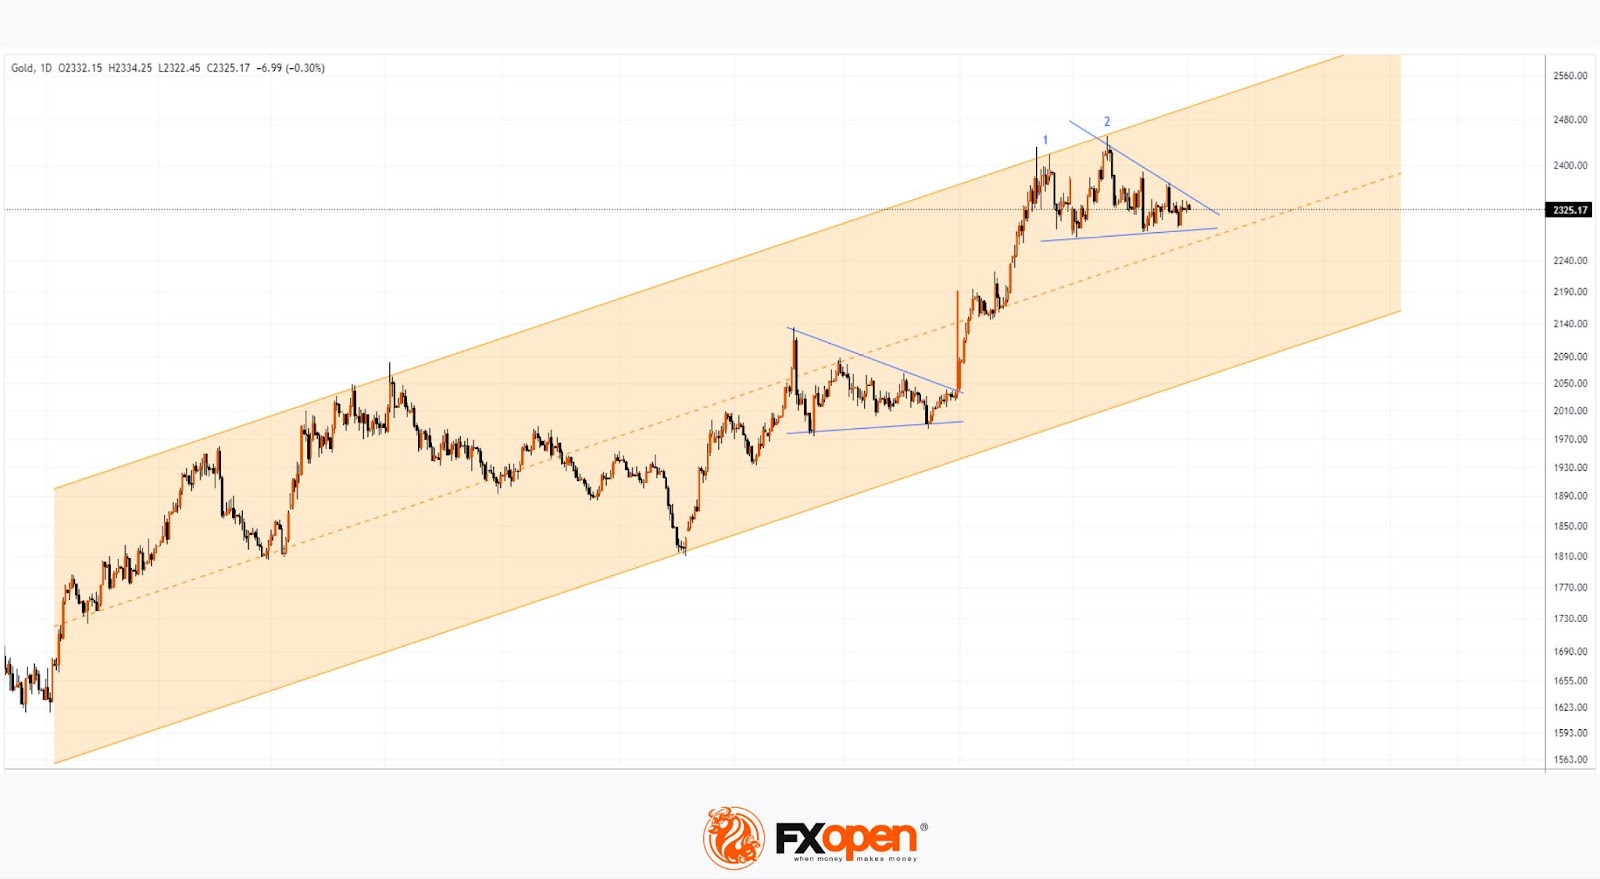
As shown by the daily XAU/USD chart:
→ Since November 2022, the price has been moving in an upward channel, marked in orange;
→ Since the start of 2024, the price has risen by approximately 12.5%.
What are the gold price forecasts for the end of 2024?
According to Investing.com, Georgette Boele, a senior sustainability economist at ABN Amro, published a cautious forecast on 27 June, predicting a gold price of $2000 per ounce by the end of the year. In her view:
→ Gold prices peaked at the beginning of the year but have since lost momentum.
→ Anticipated easing measures by central banks have not provided the expected support to gold prices.
→ Concerns about physical gold shortages, which were a factor during the COVID crisis, are unfounded in the current market.
On the other hand, longer-term forecasts are optimistic. Analysts at Bank of America believe the gold price could rise to $3000 within 12-18 months. Their arguments include:
→ Lowering Federal Reserve rates could trigger an inflow of funds into ETFs backed by physical gold;
→ The desire to reduce USD holdings in portfolios is likely to lead to increased gold purchases by central banks.
Technical analysis of the XAU/USD chart shows that:
→ After the price reached the upper boundary of the channel twice in the first half of the year (indicated by numbers), the bulls lost momentum;
→ This resulted in a consolidation pattern resembling a triangle (shown by blue lines), within which the gold price fluctuated throughout June.
Note that a similar consolidation was observed at the beginning of 2024, and a bullish breakout led to a sharp rally.
It is possible that a breakout of the current pattern could lead to a trend that significantly influences which gold price forecast—BofA’s bullish or ABN Amro’s bearish—proves more accurate.
Trade over 50 forex markets 24 hours a day with FXOpen. Take advantage of low commissions, deep liquidity, and spreads from 0.0 pips (additional fees may apply). Open your FXOpen account now or learn more about trading forex with FXOpen.
This article represents the opinion of the Companies operating under the FXOpen brand only. It is not to be construed as an offer, solicitation, or recommendation with respect to products and services provided by the Companies operating under the FXOpen brand, nor is it to be considered financial advice.
Stay ahead of the market!
Subscribe now to our mailing list and receive the latest market news and insights delivered directly to your inbox.


Latest articles

AI Valuations Are Back in the Spotlight
Artificial intelligence remains the dominant investment theme of 2026, but investors are increasingly questioning whether AI stock valuations are keeping pace with reality.
💰 Big Tech continues to invest at an unprecedented scale, with hyperscaler AI spending projected to exceed $800

AUD/CAD: Months of Indecision — Is a Breakout Finally Coming?
The Australian dollar has clawed back most of its end-of-June losses, when it touched three-month lows against the greenback amid escalating Middle East tensions. Since then, sentiment has improved: the RBA's Assistant Governor Sarah Hunter signalled the board stands ready

USD/JPY: Battling at the Top of the Triangle
On 3 July, Japan's Finance Minister, Satsuki Katayama, stated that the Ministry of Finance remains in close contact with US authorities regarding developments in USD/JPY as the yen traded near its weakest level in almost 40 years. Similar verbal