FXOpen

Who would have thought it?
Two years ago, in the grip of spiralling inflation and a considerable lull in the value of various stock market indices with major North American companies being key contingents, when financial analyses were awash with pessimism, it would have been a hard prediction that the beginning of 2024 would play host to high stock values across the board and a booming US economy.
The inflation of 2021 and 2022 was followed by high-profile banking collapses and US involvement in geopolitical instability in various global regions; however, here we are about to enter the final week of the first month of 2024, and the markets are looking extremely healthy.
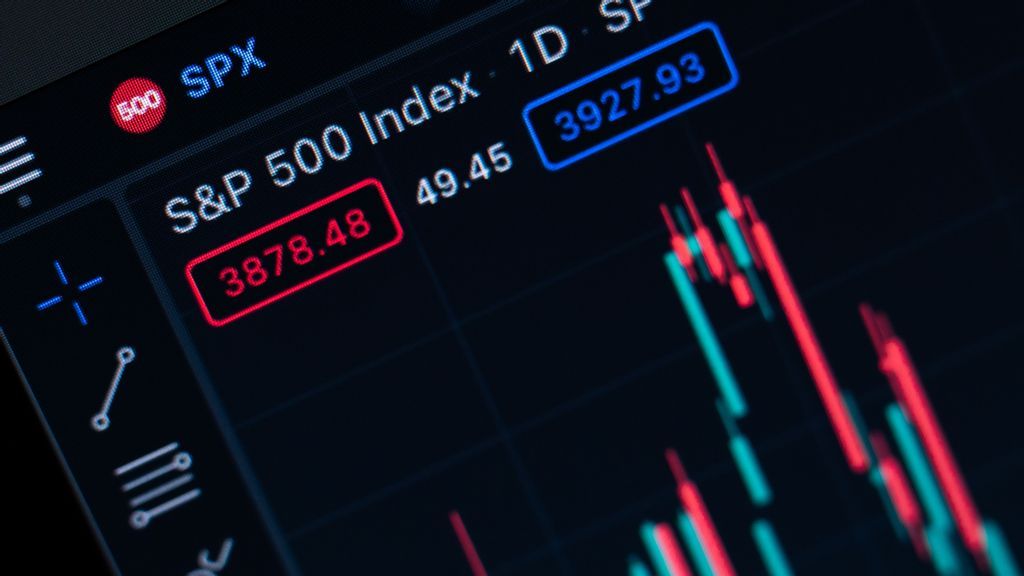
Today's focus for those observing the performance of stock markets is firmly fixed on the S&P 500 index, which concluded the US trading session yesterday at an all-time high.
This is a very interesting dynamic, especially considering that this upward direction is not unique to the prestigious stocks of long-established companies included in the S&P 500 index but is also noticeable among other indices in US markets, with the NASDAQ also having increased in value, alluding to a business-as-usual scenario in Silicon Valley.
Even more interestingly, this milestone-crossing strength appears to be organic, as there has not been a specific event that could have caused it.
Analysis this morning is focusing on relatively well-understood dynamics which have existed in US markets for a while now, alluding to the forthcoming Federal Reserve policymakers meeting on January 30 being anticipated with some degree of optimism and last week's publicised speech by the Federal Reserve Board of Governors member Christopher Waller in which he stated his optimistic point of view that the 2% target of inflation could be reached and sustained within the United States.
In the forthcoming announcements, there will be some degree of projections relating to GDP, which may be driving positive sentiment, but overall, the start to this year has heralded a stock market bonanza in the United States, perhaps in front of an unsuspecting audience who had become accustomed to the conservative monetary policy taken by the US authorities in the aftermath of the aforementioned inflation and bank crises, coupled with national debt concerns and the advancement on the global stage of economies such as China and India.
The S&P 500 has been rapidly heading for the 4,900 mark and stopped just short of that, according to FXOpen price charts at the end of yesterday's trading session in New York.
This is a monumental achievement given the revival of the markets under tough circumstances, especially considering that no specific event has created such a rise - it's purely based on overall confidence that US corporate life is back on track and doing well.
Trade global index CFDs with zero commission and tight spreads. Open your FXOpen account now or learn more about trading index CFDs with FXOpen.
This article represents the opinion of the Companies operating under the FXOpen brand only. It is not to be construed as an offer, solicitation, or recommendation with respect to products and services provided by the Companies operating under the FXOpen brand, nor is it to be considered financial advice.
Stay ahead of the market!
Subscribe now to our mailing list and receive the latest market news and insights delivered directly to your inbox.


