


S&P500 Volatility: Is It 1987 All Over Again? Not Yet!
FXOpen
Just over a week has passed since global headlines were dominated by reports on the beginning of renewed and far more serious than usual conflict in Israel and Gaza, drawing attention away from various other subjects, be they social or financial.
The inundation of social media posts and news articles has become the norm, even affecting professional platforms like LinkedIn, where many are sharing personal accounts and opinions from near and far on the geopolitical situation rather than business-related content.
In such critical geopolitical moments, it's almost inevitable that financial markets experience some form of impact.
Last week, when European and American markets opened for trading after the conflict began, the NYSE and NASDAQ exchanges, along with the US dollar, experienced significant value gains. This surge can be attributed to the presence of military companies listed on American exchanges, which garnered investor confidence in anticipation of heightened demand.
However, as the conflict rages on with no sign of peace and escalating tensions, the S&P 500 index has seen a dip.
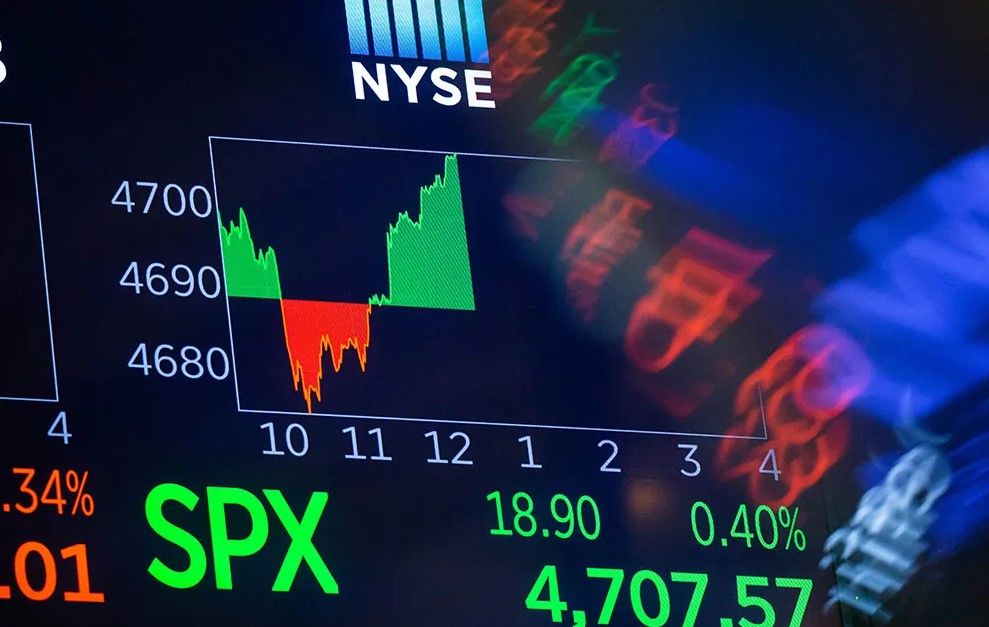
By 12:30 PM New York time on Thursday, the S&P 500 had climbed to 4,384 points due to a rally that began on Monday. By the close of the US trading day on Friday, it had fallen to 4,327 points.
Some research institutes providing commentary to mainstream media have highlighted the striking similarities between the current stock market and the 1987 market, but it's important to note that these resemblances don't necessarily portend an impending October crash.
While a third-quarter correction and weakening market breadth align the S&P 500's performance today with that of 1987, this doesn't imply an identical outcome. The fact that "Black Monday" occurred on October 19, 1987, when the Dow Jones Industrial Average plummeted by 22.6% in a single day, does set an ominous tone.
Yet, significant differences exist that mitigate the likelihood of a sudden decline like that of 1987. Circuit breakers, for instance, were implemented post-1987 to prevent a 20% decline. These circuit breakers pause trading when the S&P 500 falls by 7%, 13%, and 20%.
Moreover, although the current stock market mirrors the direction of 1987, the peak gain this year lags behind by nearly 20 percentage points in magnitude.
Divergences also extend to the broader economy. Macroeconomic data reveals substantial differences between 1987 and 2023. While economic data has outperformed expectations this year, the pace of economic acceleration is notably less compared to 1987.
In conclusion, it's worth remembering that history doesn't replicate itself; instead, it offers echoes and parallels. While there are apparent similarities between today's market and 1987, these commonalities don't imply an impending stock market crash resembling that of 1987.
What we do face today, however, is a higher degree of geopolitical tension and a digital trading environment where sudden trends in assets related to current affairs can emerge swiftly.
Trade global index CFDs with zero commission and tight spreads (additional fees may apply). Open your FXOpen account now or learn more about trading index CFDs with FXOpen.
This article represents the opinion of the Companies operating under the FXOpen brand only. It is not to be construed as an offer, solicitation, or recommendation with respect to products and services provided by the Companies operating under the FXOpen brand, nor is it to be considered financial advice.
Stay ahead of the market!
Subscribe now to our mailing list and receive the latest market news and insights delivered directly to your inbox.


Latest articles

AI Valuations Are Back in the Spotlight
Artificial intelligence remains the dominant investment theme of 2026, but investors are increasingly questioning whether AI stock valuations are keeping pace with reality.
💰 Big Tech continues to invest at an unprecedented scale, with hyperscaler AI spending projected to exceed $800

AUD/CAD: Months of Indecision — Is a Breakout Finally Coming?
The Australian dollar has clawed back most of its end-of-June losses, when it touched three-month lows against the greenback amid escalating Middle East tensions. Since then, sentiment has improved: the RBA's Assistant Governor Sarah Hunter signalled the board stands ready

USD/JPY: Battling at the Top of the Triangle
On 3 July, Japan's Finance Minister, Satsuki Katayama, stated that the Ministry of Finance remains in close contact with US authorities regarding developments in USD/JPY as the yen traded near its weakest level in almost 40 years. Similar verbal