


How to Identify Support and Resistance Levels
FXOpen
If you’re new to technical analysis of financial markets, it’s important to understand the concept of support and resistance (S/R) levels. Many trading strategies are based on them, so they are among the most widely used technical indicators.
Traders look at support and resistance to help them gain insight into the strength of a price trend and predict where it might pause or reverse course. What is support and resistance in stocks and other assets? In this FXOpen guide, we explain how to find support and resistance levels and use them in trading strategies.
What Is Support and Resistance?
In technical analysis, support and resistance are depicted as two lines on a price chart that often form psychological barriers for traders, so a price will tend to rise or fall once it reaches those barriers until it eventually breaks out and establishes a new range.
What Is Support?
The support line shows the area where the price tends to stop falling; it serves as an obstacle preventing the market from moving lower. When the price reaches support, it becomes more attractive to buyers waiting on the side lines and encourages them to enter the market. That increase in demand causes the trend to turn higher.
What Is Resistance?
The resistance line is the opposite of the support line in that it represents the area in which an upward price movement is supposed to stop, acting as a barrier to the price moving higher. Selling activity typically increases around resistance, causing supply to outpace demand and pushing the price back down.
How to Determine Support and Resistance Boundaries
S/R levels can be identified for all time periods, whether intraday, daily, weekly, or monthly. The longer the timeframe, the more significant they are.
If a price briefly touches or surpasses support or resistance but retreats quickly, it is considered to be an S/R test. But if the price breaks through for a longer period, it is likely to continue rising or falling until it finds new resistance or support.
Once support is broken, it can become resistance, so the price may retest it and continue falling, and when resistance is broken, it may become support, so the price may test it and continue rising.
There are several ways to identify S/R levels on charts.
Previous Levels
Traders track previous significant S/R levels from previous timeframes as indicators of future trends. Once they are familiar with recent pricing patterns, they take positions in anticipation of the price acting in the same ways in the future. However, it is crucial to keep in mind that past patterns may have had unique drivers and may not occur in the same way in the future. Therefore, major S/R levels can be viewed as ranges, not a single line.
Traders often compare S/R boundaries on different timeframes to confirm trends. Usually, they use three consecutive periods: the timeframe they trade on is primary, and other timeframes include shorter and longer ones. For example, if you are interested in how to find support and resistance in day trading, identifying similar levels on a 30-minute, hourly, and 4-hour chart could indicate strong support and resistance points.
Trend
Traders frequently look at a trend’s boundaries to identify potential support and resistance levels. By framing the trend, traders get two lines – on the top and the bottom of a trend – as the price constantly rebounds from them, they serve as support and resistance.
Technical Indicators
Traders apply technical indicators such as pivot points and moving averages to find S/R levels. The levels are calculated on different data; for instance, pivot points calculate open, close, high, and low prices, while moving averages are usually only based on close prices. This means that they vary significantly, and the theory requires traders to adjust them for a particular asset and timeframes.
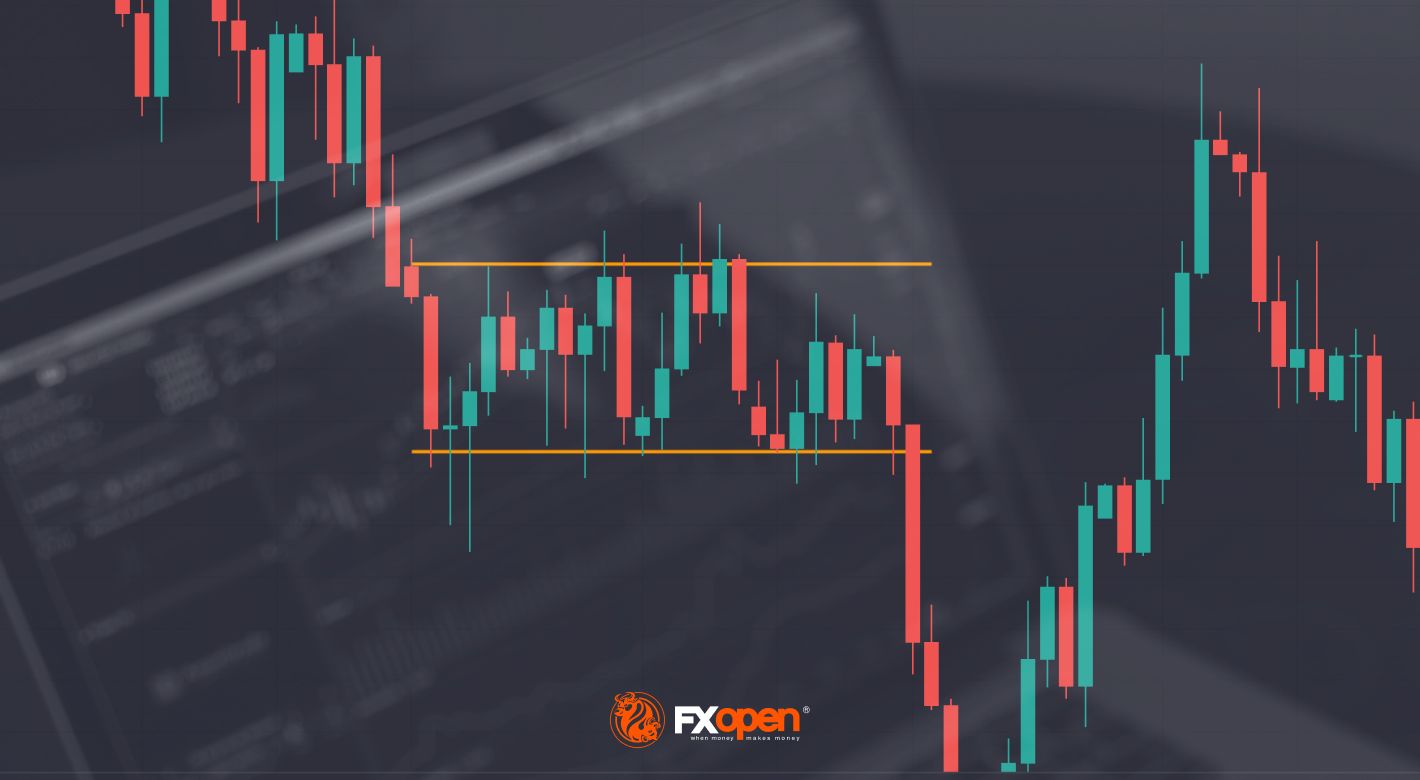
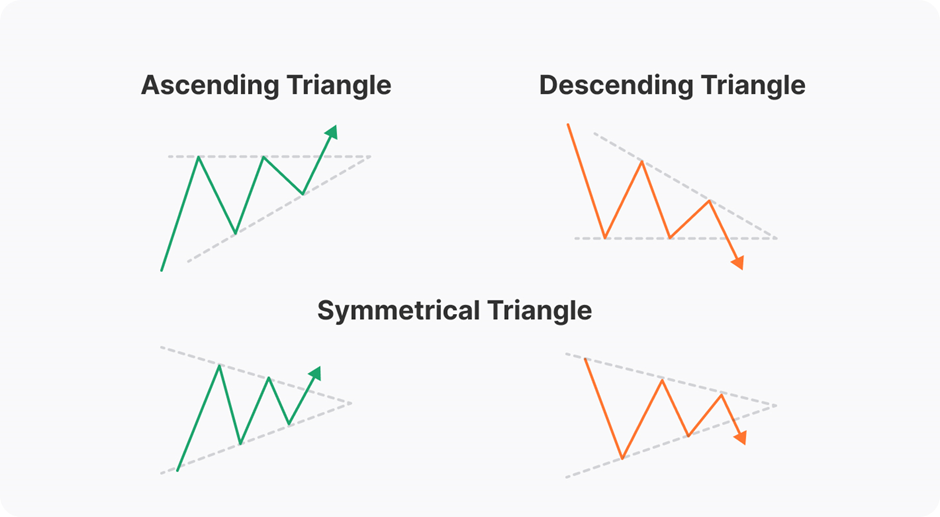
Chart Patterns
Chart patterns also include support and resistance boundaries that don’t allow the price to break beyond the pattern. For instance, triangles consist of two lines – an upper line that is a resistance and a lower line that is a support – that frame the triangle and don’t allow the price to break beyond them until a certain momentum when either bulls or bears are ready to take control of the market.
Types of Support and Resistance Lines
There are many types of S/R lines, which are formed in different ways to identify where a price could retrace or break out.
Horizontal
Horizontal lines are the most basic form. They are placed on a chart at a past point where the price faced a barrier. Horizontal lines indicate static areas of support or resistance. There is a common rule that the more often the price touches the level, the stronger it is. However, it’s vital to understand that the price can’t touch it indefinitely, so it will be broken once.
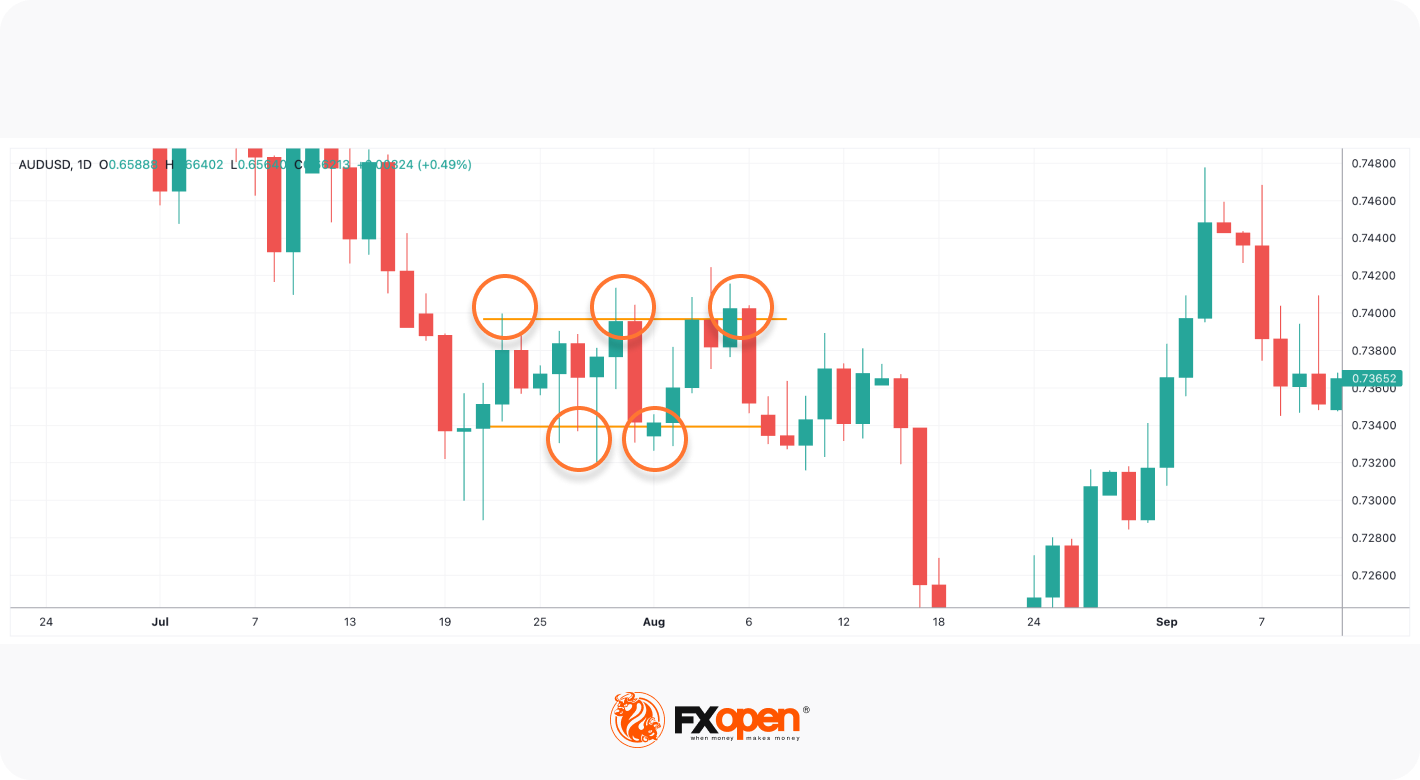
For swings, even one point is enough to place S/R levels. The point could be a clear swing high or swing low where the price previously halted or reversed its course.
Round Numbers
Round numbers, such as 0.5010 and 0.4000, form psychological support and resistance, meaning that it may be difficult for prices to break through. This is because of a psychological factor – we are used to round numbers. It’s more likely you will say ‘around 10’ than ‘9.99’. Therefore, many investors set buy or sell orders at round numbers. As there are many orders at the same point, round numbers serve as strong barriers.
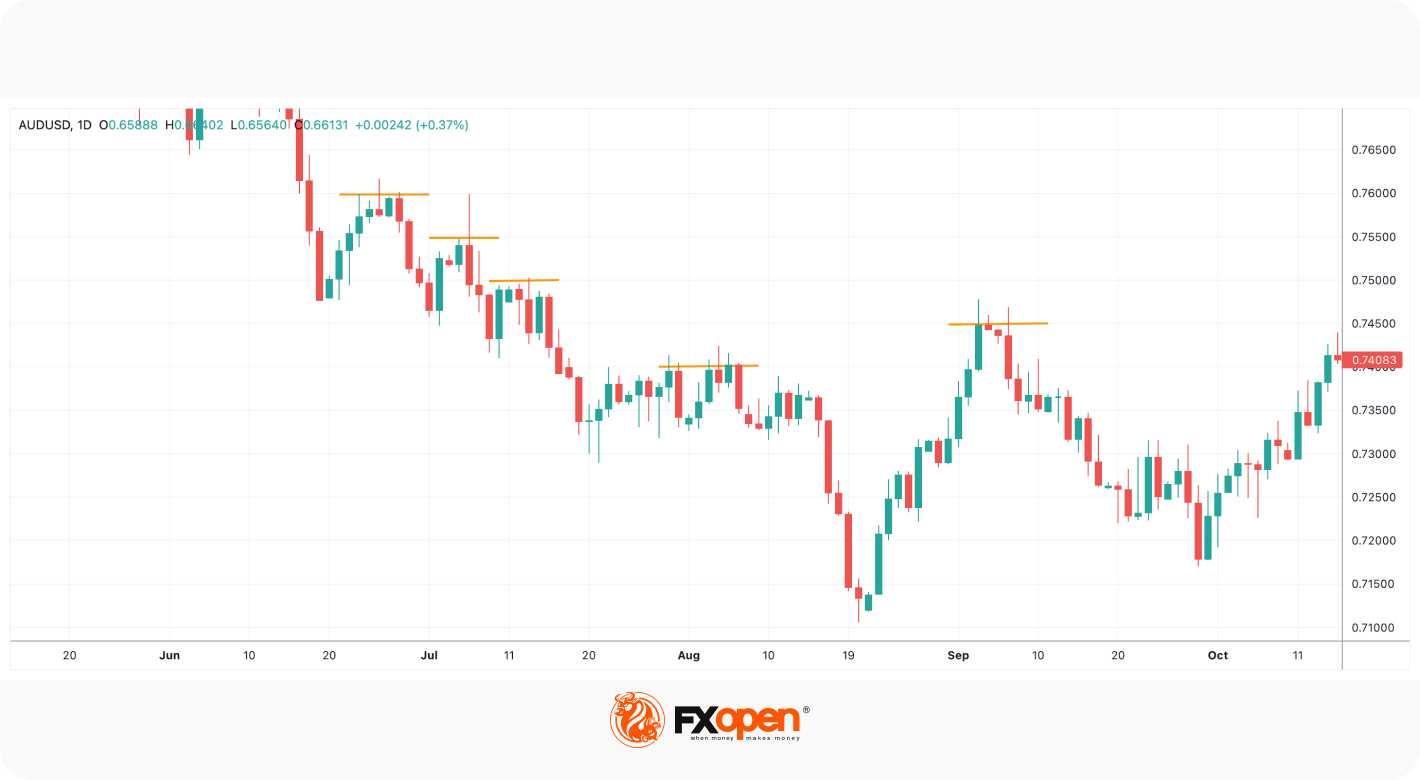
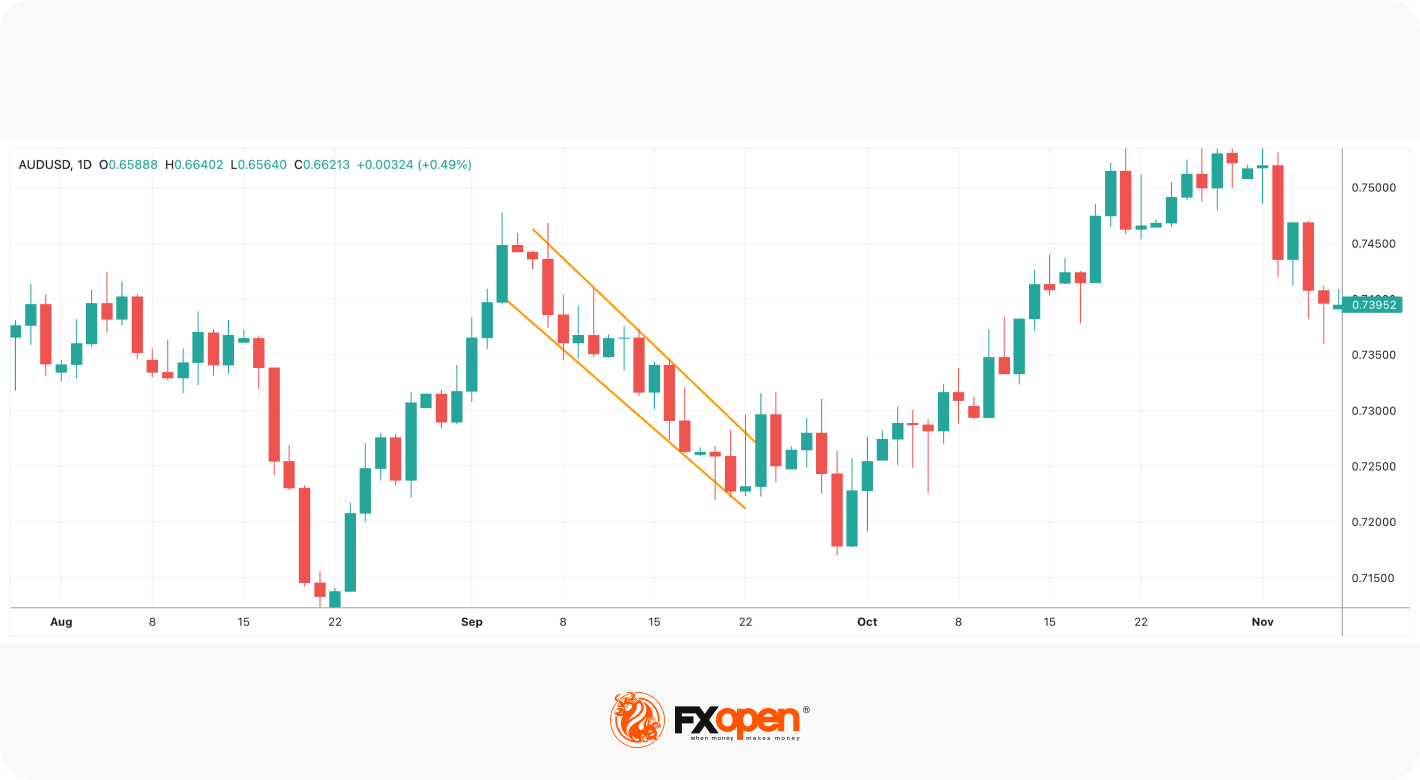
Trendlines
Unlike horizontal lines, trendlines slope upward or downward depending on the direction of a trend. Prices are likely to bounce upward from the lower line, which serves as support, and turn lower from the upper trendline, which serves as resistance. Thus, it becomes easy to identify reversal points and place buy and sell orders. As with horizontal lines, trendlines become important S/R levels when the price touches them multiple times. Also, it’s worth remembering that there must be at least two points to draw trendlines.
To draw trendlines on a chart, there should be at least two highs and two lows. In a downtrend, you connect lower highs and lower lows; in an uptrend, you connect higher highs and higher lows. To identify potential reversal points, you can extend the line.
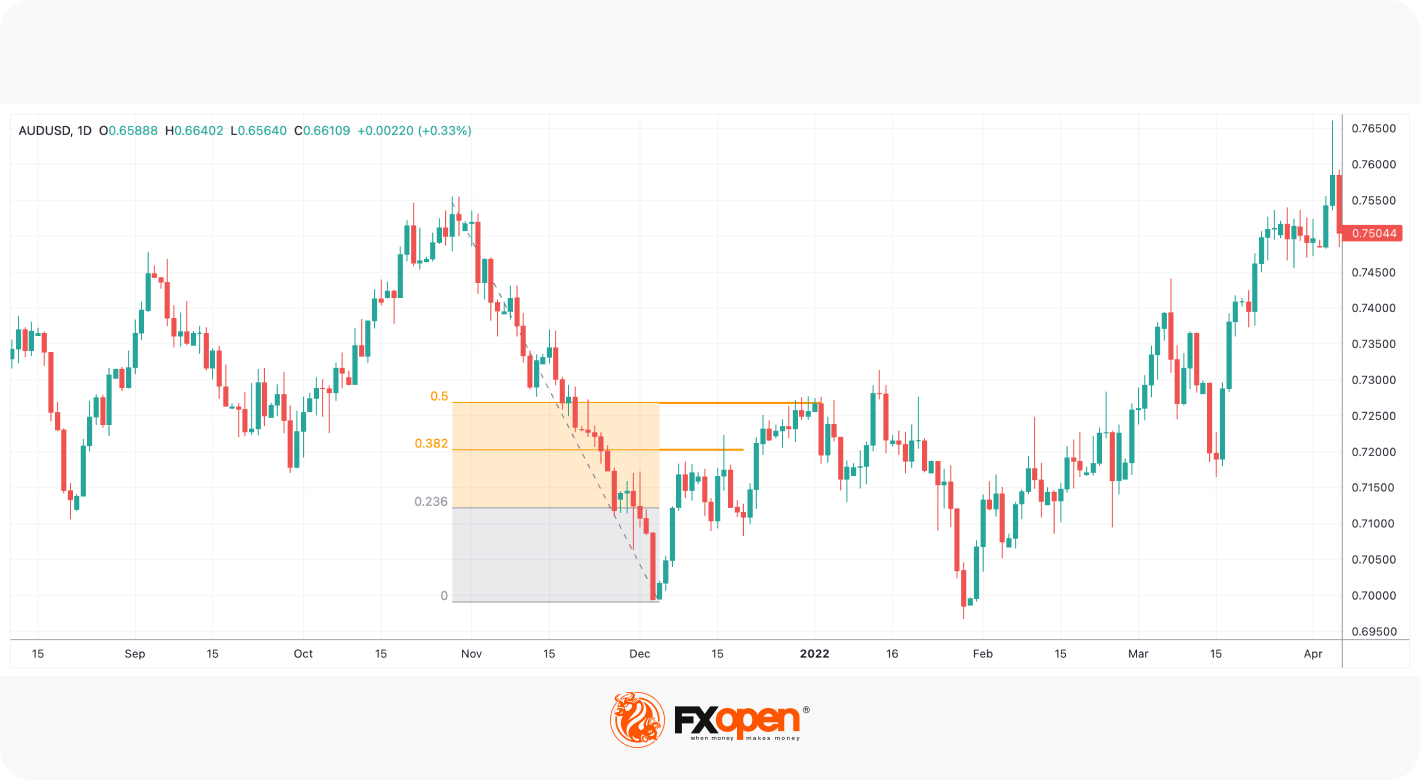
Fibonacci Retracement and Extension
Fibonacci retracements indicate S/R levels when a price is pulling back from a sharp move. Fibonacci extensions then show the potential support and resistance boundaries following the pullback.
Traders usually use 38.2%, 50%, and 61.8% retracements to predict how far a price might retrace from its previous high or low. As for Fibonacci extensions, traders pay closer attention to 123.60%, 161.8%, 200%, and 261.8%.
The TickTrader platform includes Fibonacci tools, so you can place them without difficulties.
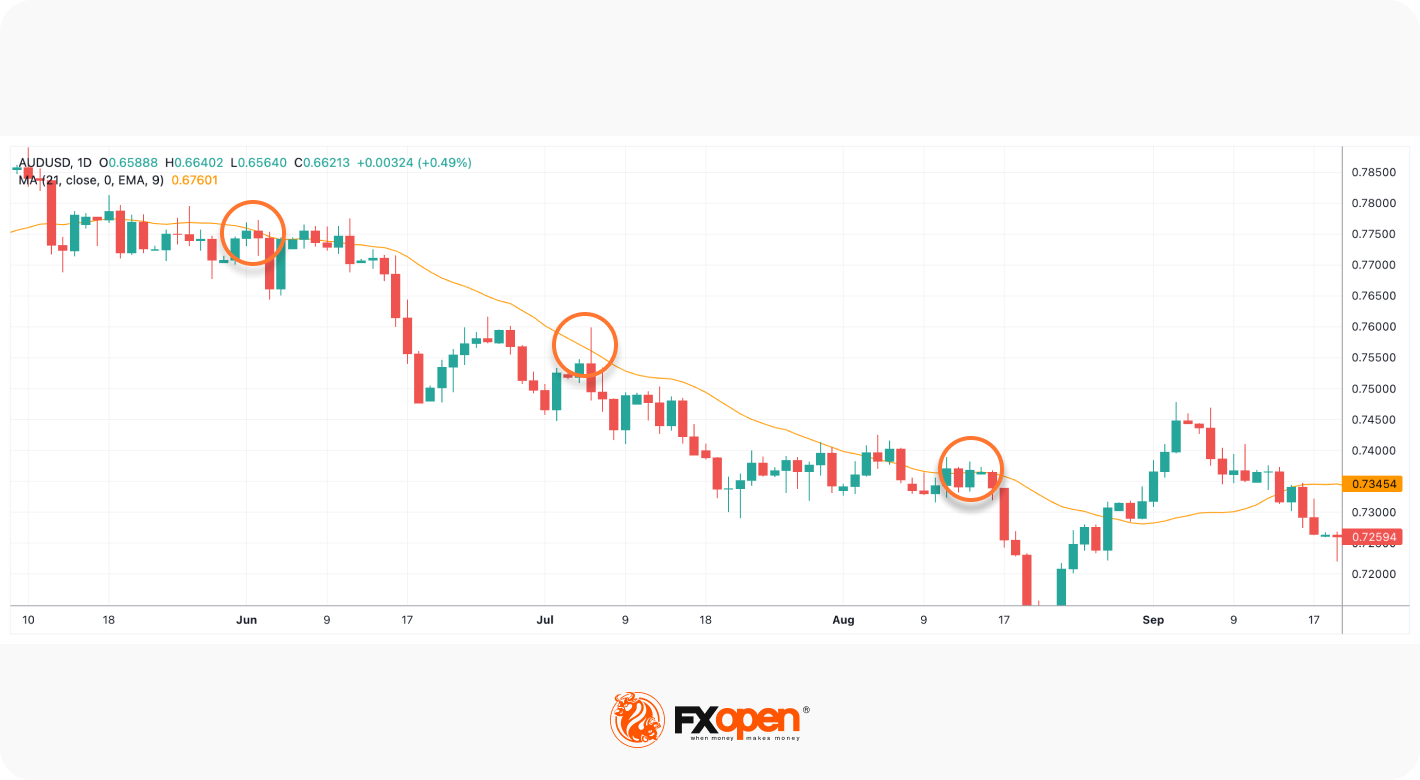
Dynamic
There can be static support or resistance from which the price bounces higher or lower or dynamic levels that change at every data point, such as a moving average. A moving average line sits below the price as support during an upward trend and moves above the price to denote resistance in an upward trend. For instance, if a price finds support at the 50-day moving average – the average close for the past 50 sessions – as the moving average changes over time, the corresponding support will also change.
Traders commonly use 50-day, 100-day, and 200-day exponential moving averages (EMAs) to identify S/R boundaries.
How to Use Support and Resistance Levels
Once you have identified an area of support or resistance on a chart, you can take it as a potential entry or exit point for trades because prices tend to bounce off the levels.
Reversal Strategy
A popular trading strategy is to open a long position when a price is approaching support and go short when it approaches resistance. You would place stop-loss orders below support and above resistance to prevent losses in case of a breakout. The take-profit target will depend on the strategy you use, but the closest resistance in a buy trade and the nearest support in a sell trade can be potential targets.
Breakout Strategy
Another popular approach is to identify prices breaking above or below significant S/R levels to enter trades that take advantage of the momentum that drives them much higher or lower.
If a breakout is confirmed by a significant trading volume, you can enter the market in the breakout direction. In this case, you can place a stop-loss below support on a buy order or above resistance in a sell trade, or you can calculate an exit point based on a risk/reward ratio.
Remember: Prices sometimes go beyond support and resistance boundaries. Rather than creating hard and fast rules, place S/R levels as ranges.
Final Words
Understanding support and resistance levels helps traders with any experience form their own trading strategies. These levels alert traders to watch for prices to either change direction or break through, confirming the strength of the current trend. You can open an FXOpen account to learn how to trade using support and resistance boundaries on live charts.
This article represents the opinion of the Companies operating under the FXOpen brand only. It is not to be construed as an offer, solicitation, or recommendation with respect to products and services provided by the Companies operating under the FXOpen brand, nor is it to be considered financial advice.
Stay ahead of the market!
Subscribe now to our mailing list and receive the latest market news and insights delivered directly to your inbox.


Latest articles

Weekly Market Insights with Gary Thomson: The Week of Central Banks and Earnings
In this video, we’ll explore the key economic events and market trends, shaping the financial landscape. Get ready for insights into financial markets to help you navigate the week ahead. Let’s dive in!
In this episode of Market

Intel at a Crossroads: Earnings Beat Meets Technical Resistance
Intel has just delivered its strongest quarter in over fifteen years, and the market reaction says it all. Q2 2026 revenue surged 25% year-over-year to $16.1 billion, crushing the consensus estimate of $14.42 billion, while adjusted EPS of

Tesla: Complex Range Structure Breaks Down Following Quarterly Earnings
Tesla released its Q2 2026 results after the market closed on 22 July. Revenue increased 26% year-on-year to $28.24 billion, while vehicle deliveries reached a record 480,126 units. However, operating margin fell sharply to 1.4%, down from