


How to Trade in Ranges: Range Trading Strategies
FXOpen
Range trading is one of the common concepts that help traders forecast a market direction and set precise entry and exit points. Range and trend trading are often confused with each other. However, they involve different trading and construction rules. Read this FXOpen guide to learn the differences between trend and range trading, how to determine ranges and trade in them.
Range: Definition
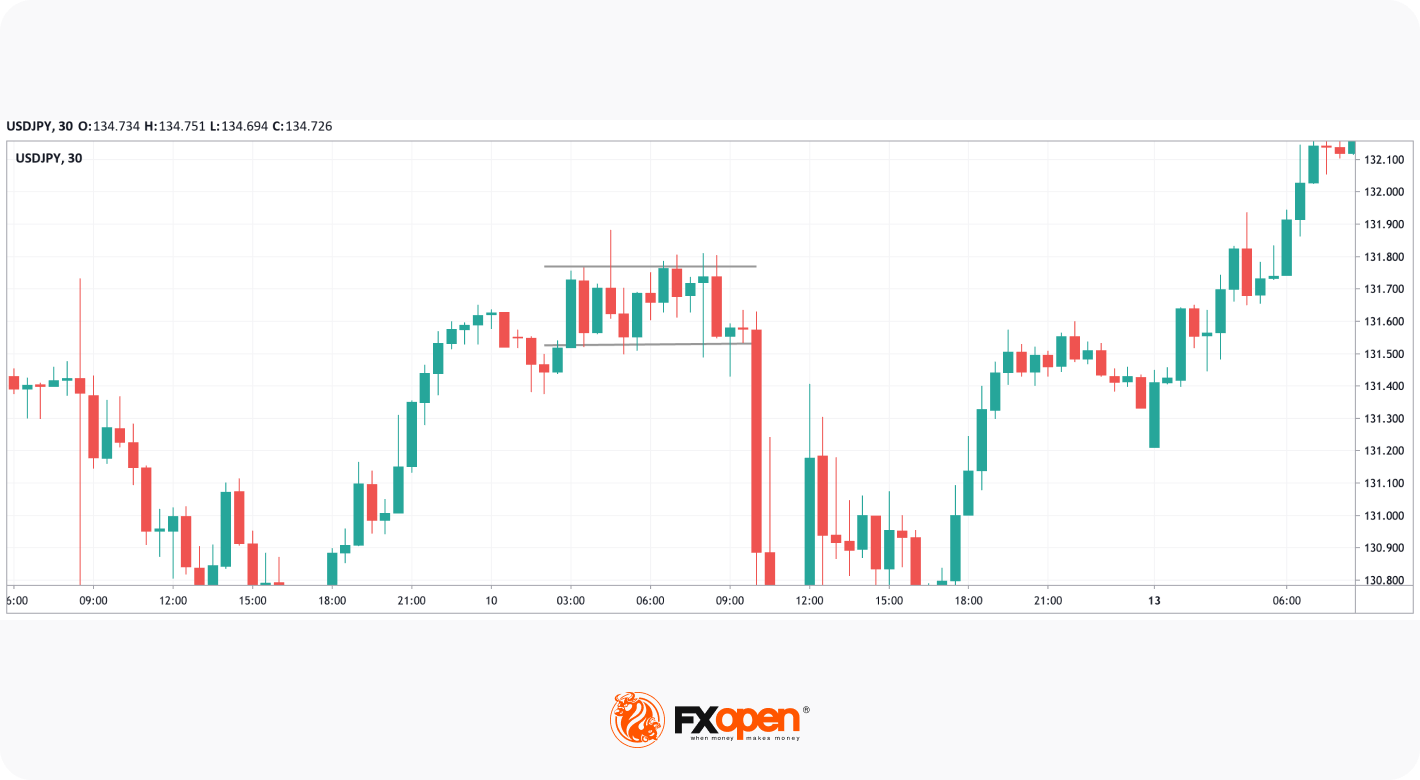
A range is formed when a price fluctuates between two levels over a particular period. Ranges are usually framed with horizontal lines that serve as support and resistance levels. To frame a range, you will need at least two highs and two lows. Ranges can be found on any timeframe of any asset. That is, you can use range trading for stocks, commodities, indices, ETFs, and currency pairs.
Why a Range Is not a Trend
A trend is also a period when a price moves between two boundaries, but these connect either higher highs and lows or lower highs and lows.
In a range, prices are almost at the same levels; thus, they move horizontally. Usually, when one trend replaces another, the price consolidates for a while. This consolidation is a range. Also, there can be a channel pattern within a trend that signals a pause. At this point, buyers or sellers need to decide whether they can drive the trend further.
Many traders follow the rule: the trend is your friend. This means that you trade in the direction of the trend. If it’s an uptrend, you go long; if it’s a downtrend, you go short. As for the range, you can trade both buying and selling.
How to Trade a Range
There are two common strategies used when trading in a ranging market – within the range or on its breakout.
Note: it’s unlikely you will find a perfect range where the price rebounds precisely from the support and resistance levels. Be ready for the price to reverse before it approaches the levels or goes beyond them.
Range Trading Strategy
In most cases, range traders open positions within a range. The rule is that a trader buys at a support level and sells at a resistance level. However, the price does not always touch the boundary before a reversal and may even go beyond it. Therefore, the strategy requires adjustments. Some traders use pending orders to avoid missing a trade.
Entry. An entry point is usually placed near support when buying and near resistance when selling.
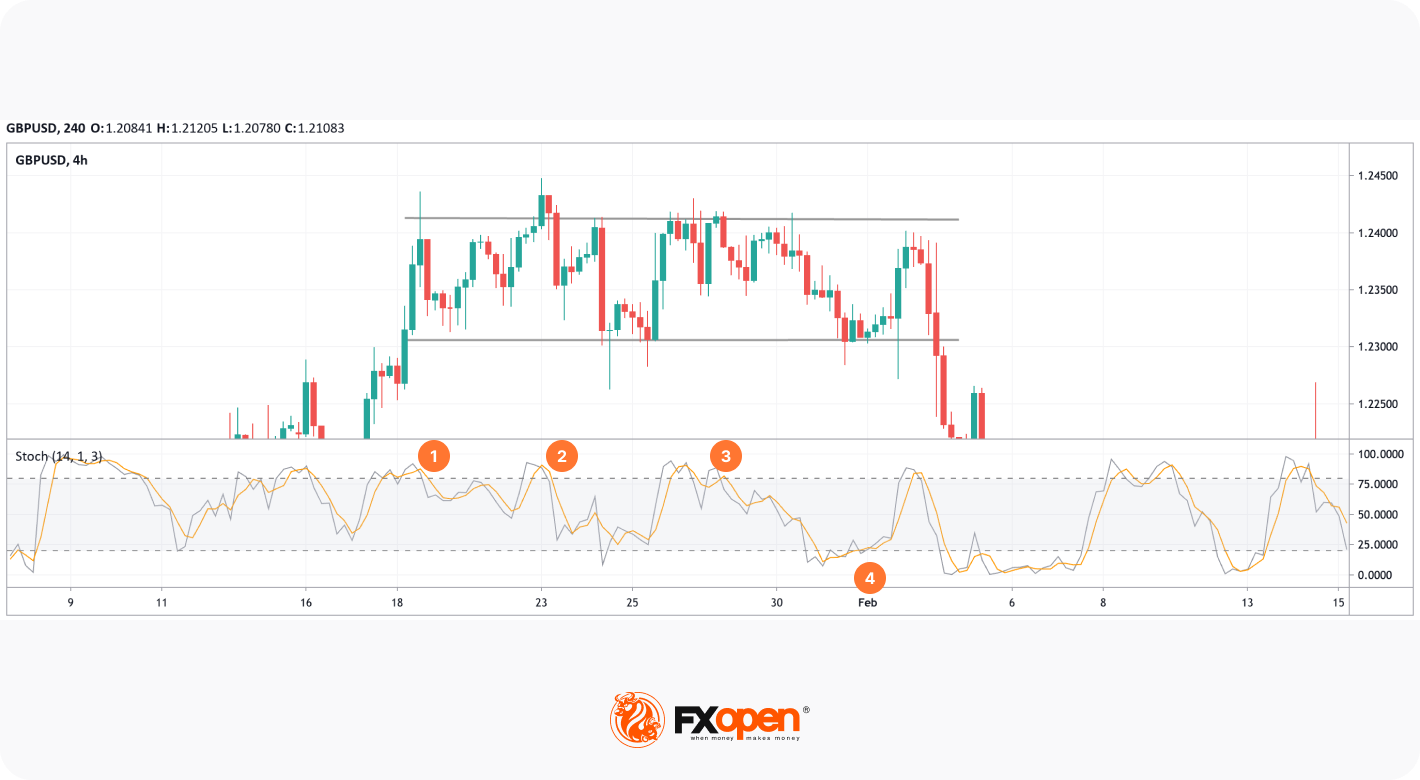
There are no specific range trading indicators. However, traders commonly use oscillators to predict reversals within ranges – for example, a Stochastic oscillator. Considering its overbought/oversold signals, a trader could open positions at points 1, 2, 3, and 4.
Stop loss. Traders place a stop-loss order below the support boundary when buying and above the resistance boundary when selling. The stop-loss size depends on the width of the range, current market conditions, and the trader’s approach. It’s worth remembering that, as the price can go beyond the range but return to it soon, a stop-loss may be triggered early. Therefore, traders prefer a large risk/reward ratio of 1:2. Some experienced traders utilise a 1:1 ratio.
Take profit. As the price may turn around before touching either boundary, the theory suggests traders place take-profit targets a few points below the resistance or above the support. To develop your own strategy, you can use the TickTrader platform by FXOpen.
Trade a Breakout
The price can’t constantly move within a range. After a period of horizontal movement, it will definitely break beyond the range in either direction. Traders use a breakout as an opportunity to enter the market at the early stages of a new trend or of the continuation of an existing one.
Entry. Traders wait for the price to break beyond either range boundary and open a trade in the breakout direction. To validate the breakout, they usually use volume and trend indicators. A breakout should be accompanied by increased trading volumes; otherwise, it will turn into a fakeout.
*Fakeout is a market condition in which a price moves beyond a boundary but returns to the pattern or the range.
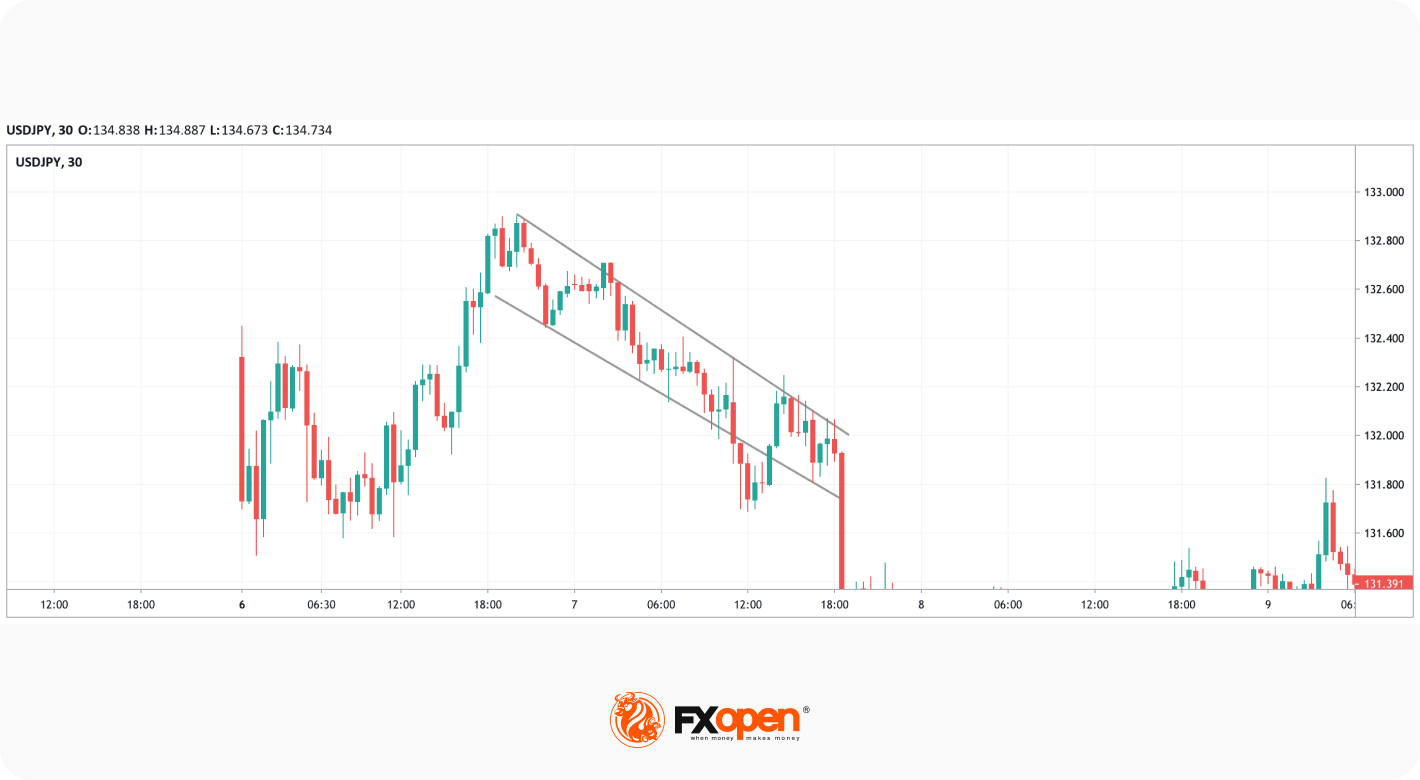
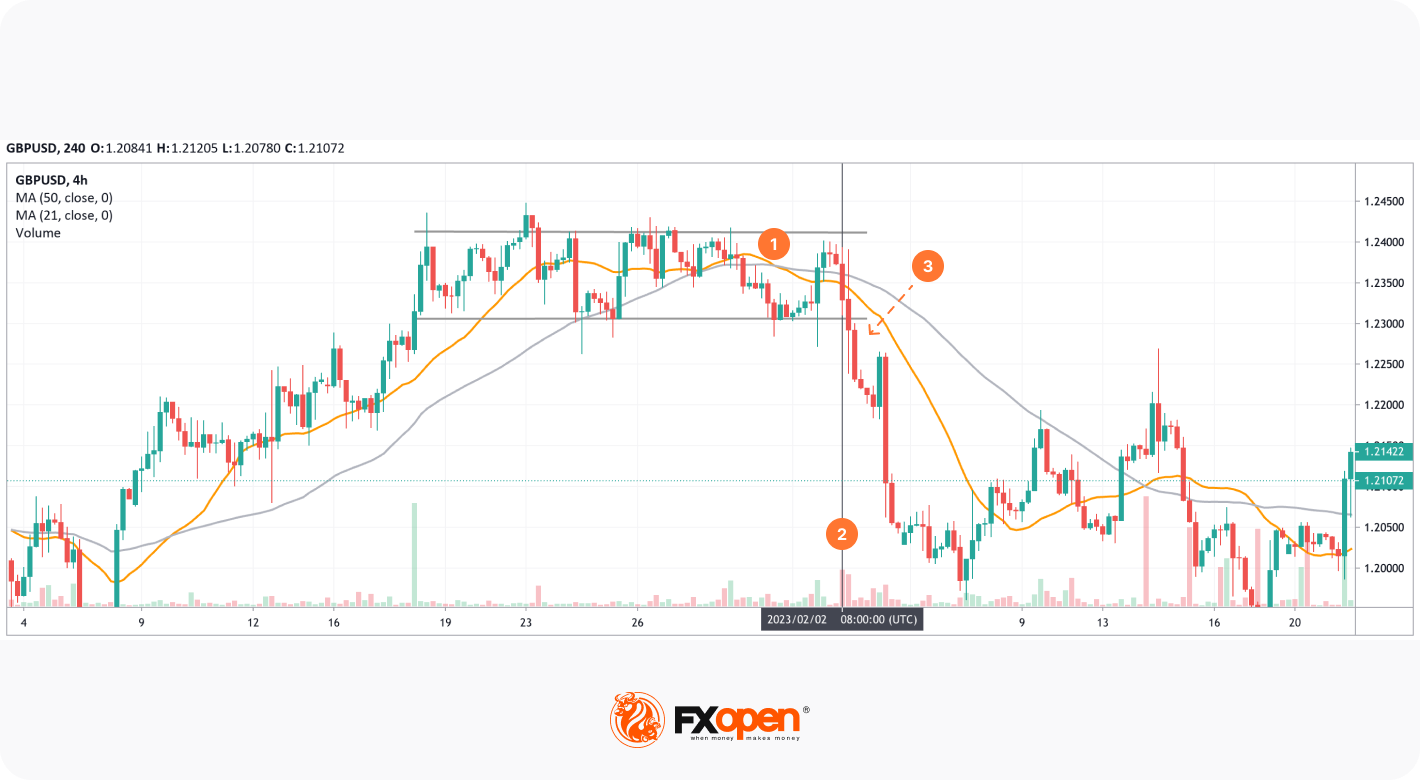
For instance, in the chart below, the 21-period simple moving average (orange) fell below the 50-period simple moving average (grey), providing a sell signal (1). However, if a trader had gone short immediately, they would have failed. After the next swing high, long bearish candles started forming, which could signal an impending breakdown. Moreover, bearish volumes increased significantly (2). Point 3 could be considered for an entry.
To predict whether the breakout will occur in a trend direction or whether it will turn into a trend reversal, traders pay attention to the range length. Usually, it’s short in a current trend and long when trends change around. Also, if there are no signs of a trend reversal from trend indicators, the probability of a trend reversal is lower.
Some traders use pending orders, such as buy/sell stop and buy/sell stop limit. Pending orders allow traders to enter the market at the best possible price without constantly monitoring a chart.
Stop loss. When entering a market on breakouts, traders usually place a stop-loss below a resistance level in a buy trade and above a support level in a sell trade. The size of a stop-loss order should be determined according to a particular strategy and current market conditions. A common rule is to use 1:2 and 1:3 risk/reward ratios.
Take profit. The take-profit size can’t be identified by the range alone. It will depend on your strategy and risk approach. You can test different approaches on the TickTrader platform.
Final Thoughts
Range trading is one of the most common approaches, as it allows traders to predict a market movement with a high level of certainty. When the price moves within a range, it’s likely to rise near the range’s lower bound and fall near its upper bound. Now you know how to trade breakouts, so you can open an FXOpen account to use your knowledge in the live market.
This article represents the opinion of the Companies operating under the FXOpen brand only. It is not to be construed as an offer, solicitation, or recommendation with respect to products and services provided by the Companies operating under the FXOpen brand, nor is it to be considered financial advice.
Stay ahead of the market!
Subscribe now to our mailing list and receive the latest market news and insights delivered directly to your inbox.

Latest articles

GBP/CHF: Trendline or RSI — Which One Is Lying?
Sterling enters this week on firmer footing, with political uncertainty fading fast after Andy Burnham's confirmation as Labour leader eased investor concerns over the succession to Keir Starmer. Markets reacted further to reports pointing to Shabana Mahmood as the frontrunner

Silver Attempts to Break Out of Its Range
Silver continues to balance between its dual role as an industrial metal and so-called refuge asset, and this combination largely explains the lack of a clear trend in recent weeks. Shifting expectations for central bank interest rates can influence the

Nasdaq 100: Is This the Correction Traders Have Been Waiting For?
The Nasdaq 100 (US Tech 100 Mini on FXOpen) remains caught between two opposing forces: cooling inflation on one side, and persistent geopolitical instability on the other. On 14 July, June's CPI print came in softer than expected, easing near-term