


How to Trade with a Momentum Indicator
FXOpen
The momentum oscillator (MOM) is a vital instrument in the trader's toolkit. Designed to measure the velocity of asset price changes, it serves as a compass for traders, pointing them towards prevailing market trends. By analysing this indicator, traders can gain insights that allow them to seize budding opportunities in volatile markets. Keep reading to broaden your understanding and elevate your momentum indicator strategies.
Momentum Technical Analysis
Momentum technical analysis is a crucial aspect of understanding the financial markets. Traders and investors rely on momentum tools to identify potential trends and make trading decisions.
What Is a Momentum Technical Indicator?
While the term "momentum" is often tossed around in financial circles, its technical significance is profound. Momentum indicators are a class of technical analysis tools that quantify the strength and direction of market trends. They help traders and investors identify potential reversal points, overbought or oversold conditions, and the continuation of existing trends. These tools are based on the principle that price trends often exhibit momentum before they reverse or continue. However, there is also such a thing as a momentum oscillator.
Momentum Oscillator
The momentum indicator or oscillator (MOM) is a technical analysis tool that’s available on most trading platforms, including services like FXOpen’s TickTrader. It’s one of the best momentum indicators. The MOM displays the speed of change in a financial instrument's price over a specific time frame. You can apply the momentum indicator to forex, stock, commodity, and crypto* markets.
MOM formula = (Current Close/Close N Periods Ago)*100
By default, the indicator is set to 10 periods, but traders can easily change this in the settings tab. The calculated values are plotted below the trading chart as a single line that moves near the 0 line. If today's price is the same as it was 10 days ago, the indicator's value is plotted on the zero line. If today's price is higher than it was 10 days ago, the indicator plots above the line, and vice versa.
When trading stocks, the momentum indicator typically fluctuates between +/- 20, while for forex pairs, its range is more like +/- 0.02. The chart below provides an example of how the momentum oscillator is used on a daily GBP/USD chart.

How to Use the Momentum Oscillator
Here's a breakdown of the procedure for using the momentum indicator in trading:
Tapping into the potential of the MOM is quite straightforward. For those who swear by MetaTrader, it's as easy as venturing into the oscillators section to access the momentum indicator on MT4 or MT5. For TickTrader enthusiasts, a quick search on the list of indicators should yield the built-in MOM.
Zero-Line Crossover
Keeping an eye on the MOM indicator when it crosses the zero line is the most straightforward and fundamental trading technique. An upward momentum (with values above the midpoint) often suggests a potential buy signal, implying the asset is likely to continue its upward movement. Conversely, when the MOM consistently hovers below the midpoint, it indicates a sell cue, hinting at a possible continuation of the asset's downward trajectory.
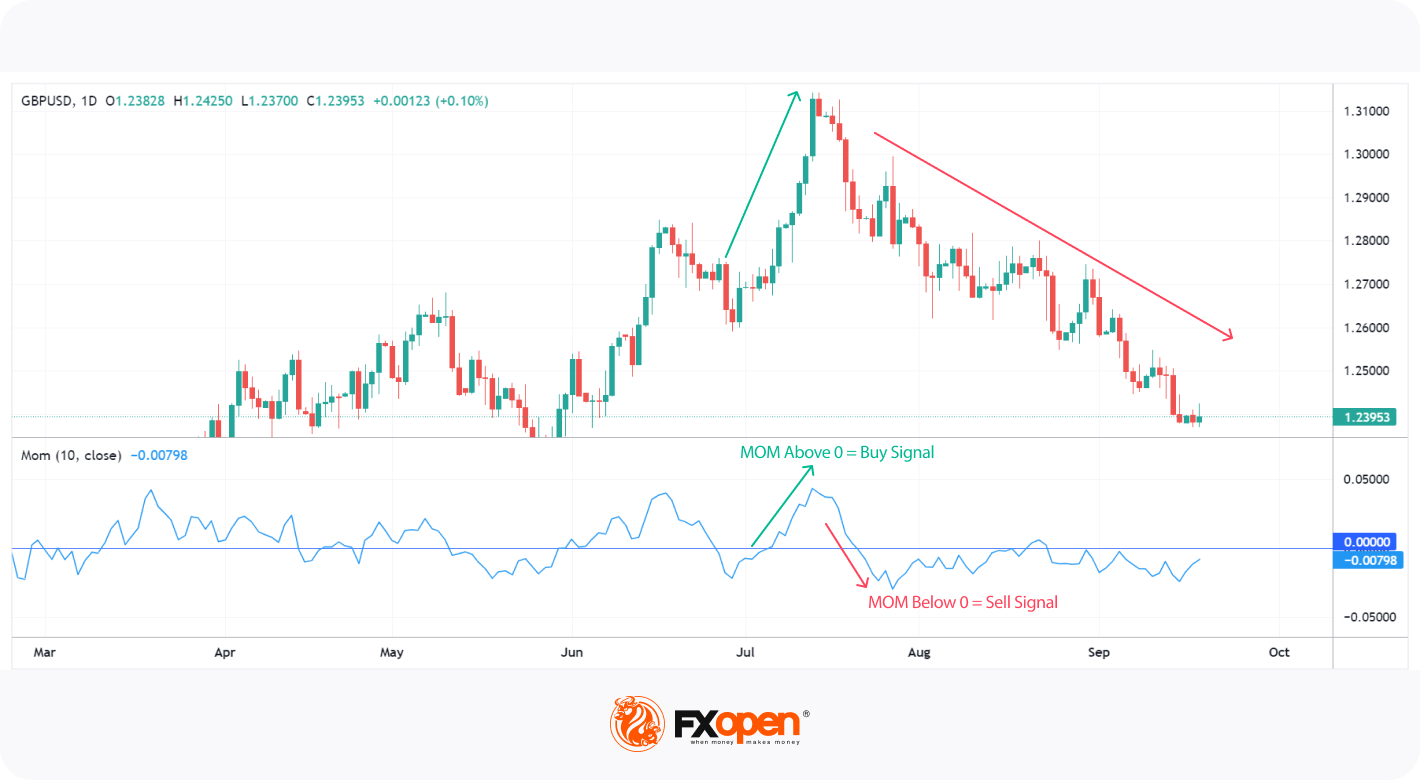
Take, for instance, the GBP/USD pair. As the pair spirals downward, a consistent position below zero signals a dominant momentum steering, it further down and vice versa.
Divergence Trading Momentum Oscillator
The momentum oscillator is instrumental in pinpointing divergences on a chart. Essentially, a divergence arises when there's a discrepancy between the market movement and the MOM, akin to top momentum indicators like the Stochastic or RSI. It often hints at a forthcoming shift in market direction.
There are primarily two forms of divergences:
- Classic (Regular): This is used to anticipate potential trend reversals.
- Hidden: This aids in identifying the likely continuation of existing trends.
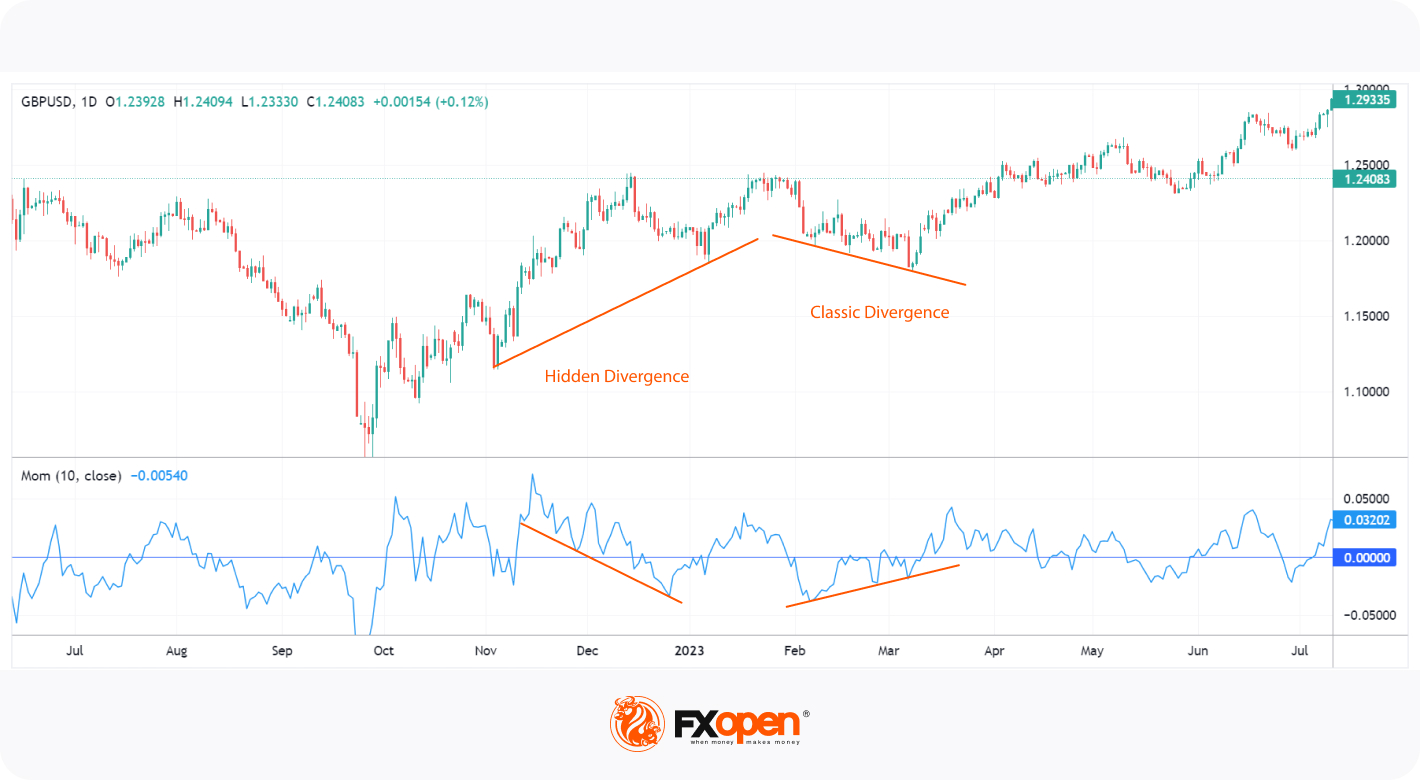
For instance, in the GBP/USD chart, we notice a hidden bullish divergence pointing to the trend's continuation and a classic bullish divergence pointing to a trend reversal.
Extreme Readings
Extreme readings in momentum indicators can provide valuable insights for traders by indicating potential overbought or oversold market conditions. As the momentum oscillator is unbounded, it’s harder to identify overbought and oversold conditions compared to the RSI or the Stochastic oscillator.
To do this, a trader needs to compare recent highs and lows. If the oscillator reaches a significant peak, the asset can be considered overbought and may fall soon. Conversely, if the oscillator falls to noticeable lows, the asset may be oversold and may rise soon.
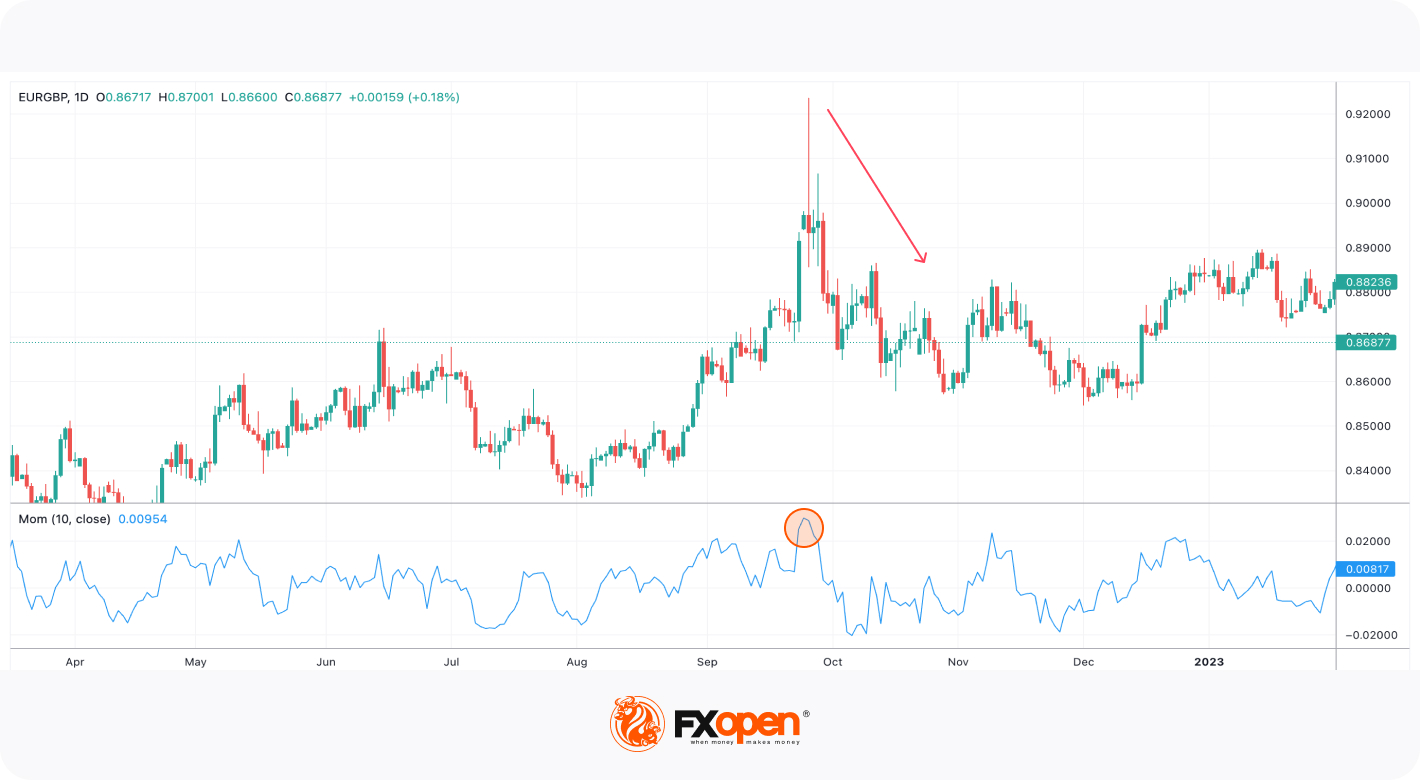
In the chart above, the momentum oscillator reached a significant high, following the uptrend in the EURGBP pair. After that, the price moved down.
When using the momentum oscillator, traders incorporate additional technical indicators and filters to avoid overtrading and reduce market noise.
How to Combine the MOM with Other Technical Analysis Tools
By incorporating a 200-period EMA on the chart along with the MOM, we can discern the overarching market trend. A price positioned above the 200-period EMA is indicative of an uptrend, prompting traders to scout for bullish signals on the MOM. On the flip side, a price below this suggests a downtrend, warranting a lookout for bearish signals.
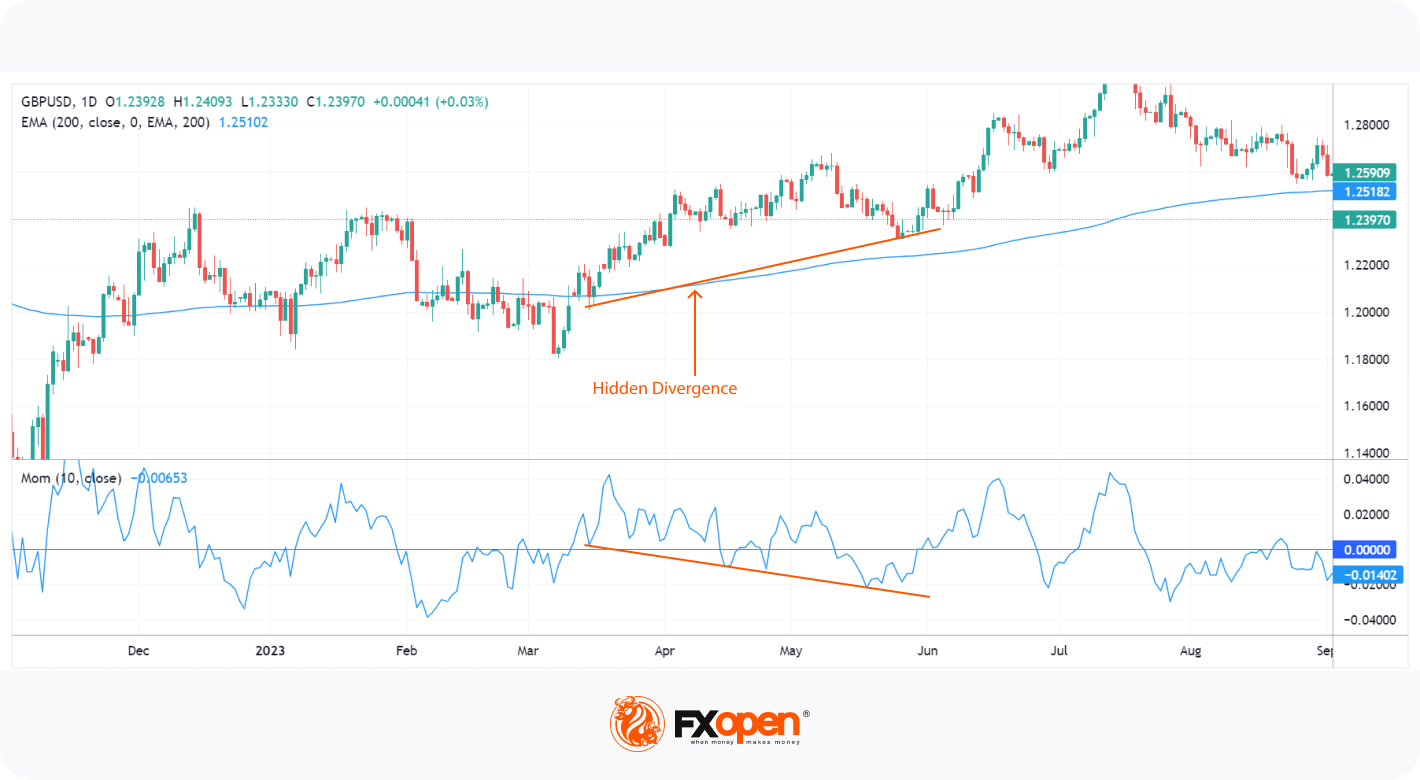
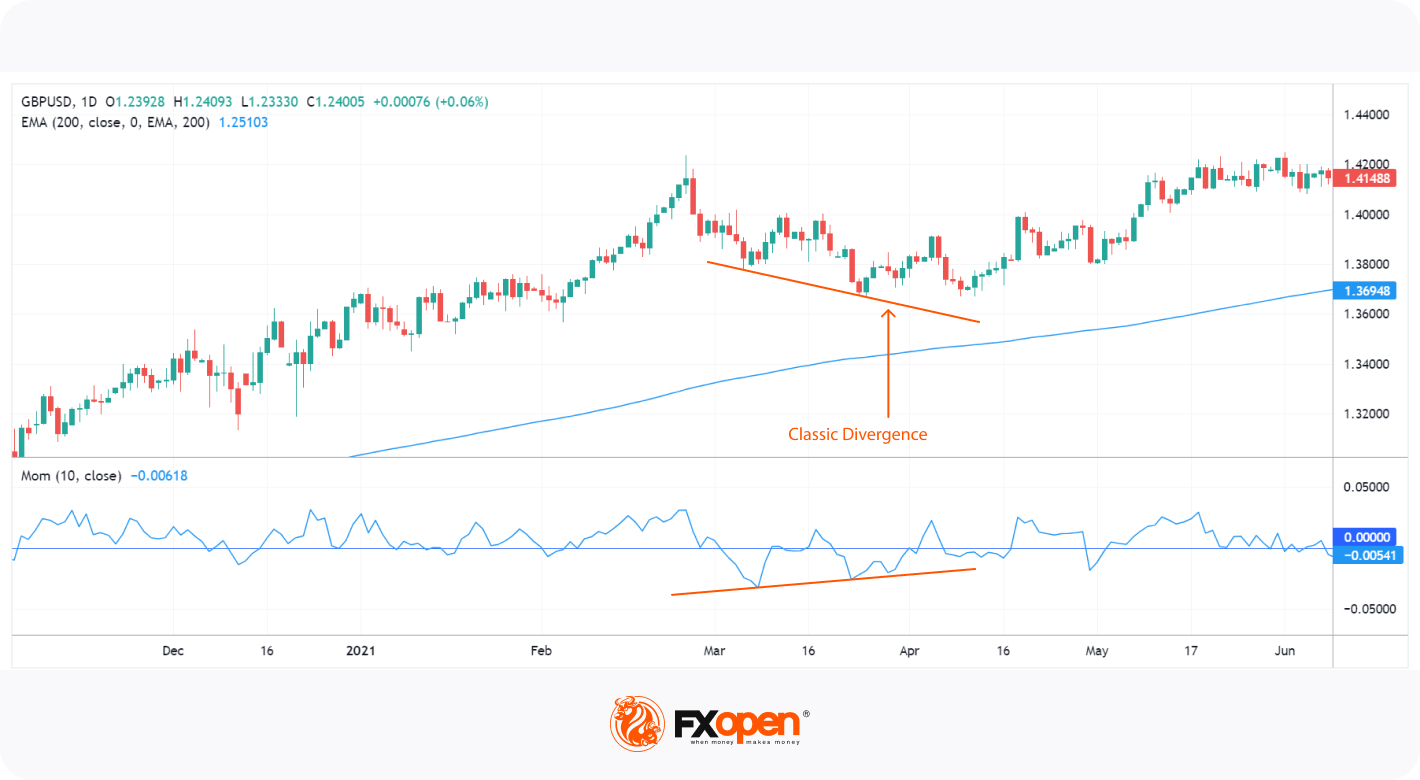
For instance, in the GBP/USD chart, we notice an upward market trajectory marked by two bullish divergence signals: a hidden one pointing to the trend's continuation and a classic one pointing to the trend’s reversal.
Conclusion
To succeed in trading, finding financial assets with momentum is key. The momentum indicator can help traders identify these assets before they make big moves, but it's important to remember that it’s not foolproof. Other technical and fundamental analysis tools are often used to evaluate market trends. To start utilising the MOM and many other tools, consider opening an FXOpen account.
*At FXOpen UK and FXOpen AU, Cryptocurrency CFDs are only available for trading by those clients categorised as Professional clients under FCA Rules and Professional clients under ASIC Rules, respectively. They are not available for trading by Retail clients.
This article represents the opinion of the Companies operating under the FXOpen brand only. It is not to be construed as an offer, solicitation, or recommendation with respect to products and services provided by the Companies operating under the FXOpen brand, nor is it to be considered financial advice.
Stay ahead of the market!
Subscribe now to our mailing list and receive the latest market news and insights delivered directly to your inbox.


Latest articles

NZD/USD: Inflation Surge Meets Strong US Dollar Pressure
On 21 July, Stats NZ reported an acceleration in inflation: the Consumer Price Index rose 1.5% in the second quarter, while the annual inflation rate climbed to 4.1%, its highest level in more than two years and slightly

Weekly Market Insights with Gary Thomson: The Week of Central Banks and Earnings
In this video, we’ll explore the key economic events and market trends, shaping the financial landscape. Get ready for insights into financial markets to help you navigate the week ahead. Let’s dive in!
In this episode of Market

Intel at a Crossroads: Earnings Beat Meets Technical Resistance
Intel has just delivered its strongest quarter in over fifteen years, and the market reaction says it all. Q2 2026 revenue surged 25% year-over-year to $16.1 billion, crushing the consensus estimate of $14.42 billion, while adjusted EPS of