


How to Trade with Hybrid Strategies
FXOpen

In today's intricate financial landscape, traders have an array of strategies at their disposal. This article delves into the core methods—technical, fundamental, and algorithmic/quantitative analysis—and introduces the concept of hybrid strategies. Learn how combining these techniques can offer a balanced approach to trading, enhancing decision-making and risk mitigation.
Creating Hybrid Trading Strategies
In the world of trading, there are primarily two schools of thought: fundamental analysis (FA) and technical analysis (TA). Fundamental analysis delves deep into economic indicators such as GDP, inflation rates, and earnings reports, aiming to assess an asset's intrinsic value.
On the other hand, technical analysis focuses on studying past price movements and trading volumes, often through charts, to predict future activity. You can find all the charts and tools necessary for technical trading strategies over in FXOpen’s free TickTrader platform.
While both approaches have their merits, a growing number of traders are blending these methodologies to create what are known as hybrid strategies.
Creating a hybrid strategy involves integrating the predictive elements of both FA and TA. For example, a trader might consider an asset's economic indicators to gauge its inherent value and then use technical tools like Moving Averages or Bollinger Bands to time their entries or exits. The aim is to capitalise on the strengths of each approach while mitigating their individual weaknesses.
Beyond traditional financial markets, the principles of hybrid strategies have been used for cryptocurrencies*. Given the highly volatile and dynamic nature of crypto* assets, a well-crafted crypto* trading strategy often incorporates both fundamental and technical elements.
While fundamental analysis in crypto* trading might involve studying the utility and adoption rates of a specific digital asset, technical analysis frequently employs chart patterns and indicators to gauge market sentiment. Combining the two in crypto* trading methods can offer a more comprehensive understanding of market conditions, allowing traders to better position themselves for potential opportunities while managing risks effectively.
Strategy 1: Overbought/Oversold after News Release
The overbought/oversold after news release strategy capitalises on short-term market fluctuations that occur as a reaction to major economic announcements, using the Relative Strength Index (RSI) to determine whether the price is overbought or oversold. This approach is particularly effective on lower timeframe charts, where quick reversals are more pronounced.
Entry
Traders often wait for a significant economic news release that could impact the market.
Once the RSI indicator crosses back below 70 or above 30, an entry point is typically considered.
Stop Loss
Stop losses are commonly set at the most recent swing high or low to protect against adverse market moves.
Take Profit
Traders usually aim for a risk-reward ratio of at least 1:2. Profits are often taken at established support or resistance levels, depending on the direction of the trade.
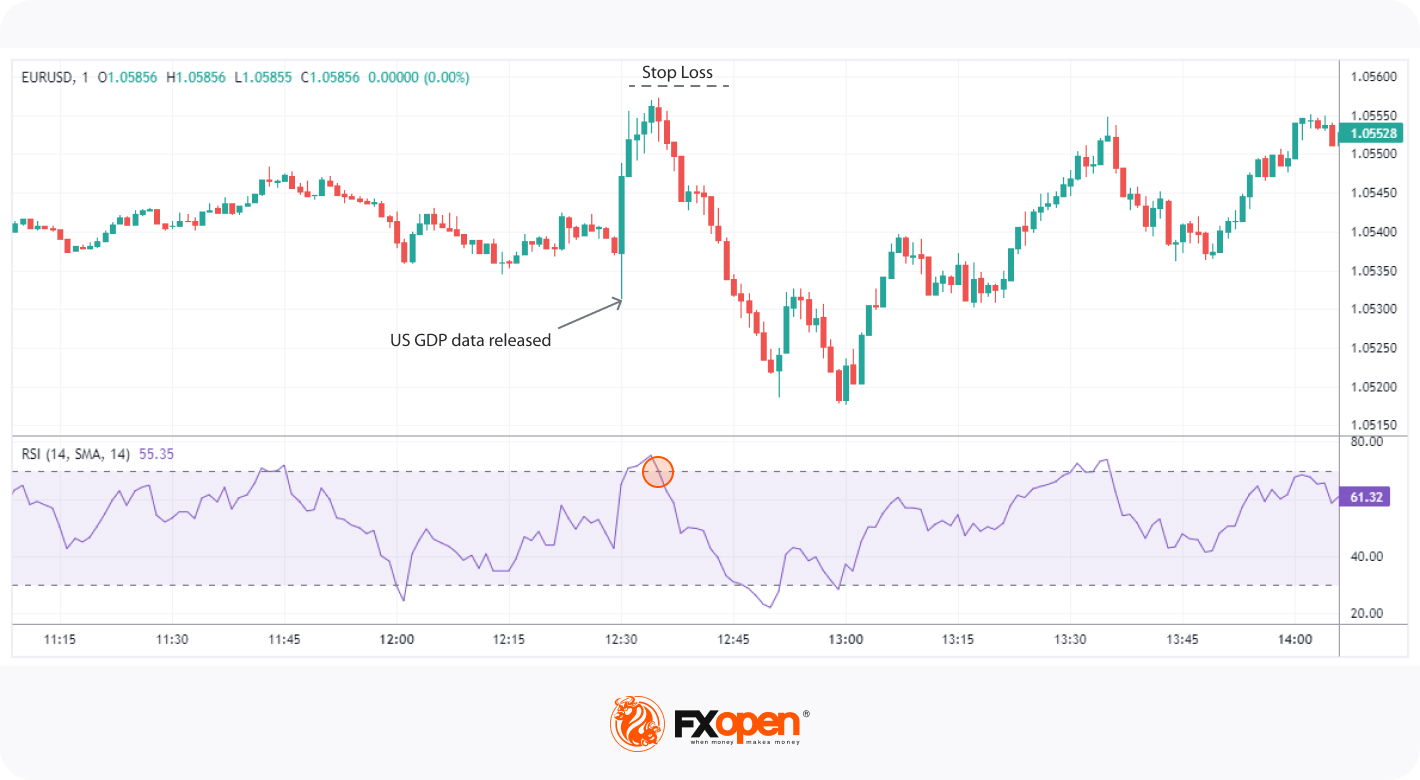
In this example, we see the EUR/USD currency pair immediately after the release of US GDP data. The news caused a spike in the pair's price, pushing the RSI above 70, indicating an overbought condition. After the initial excitement, the RSI crossed back below 70, and a retracement followed. Traders using this strategy could have considered this an opportune point for a short position, expecting the price to revert to a mean or proceed downward.
Strategy 2: Interest Rate Differential Pullback
The interest rate differential pullback strategy leverages the disparity in interest rates between two currencies to predict long-term directional bias. By combining this fundamental factor with a technical setup involving 50-period and 200-period EMAs, traders can pinpoint high-probability entry and exit points. This strategy is often most effective on higher timeframe charts such as the 4-hour or daily.
Entry
Traders usually identify a currency pair with a substantial interest rate differential. After a pullback in the prevailing trend, entry is typically considered when a crossover between the 50-period and 200-period EMA appears in the direction of the trend.
Stop Loss
Stop losses are commonly set below recent swing highs or lows. Alternatively, they can be set below or above either of the EMAs, depending on the trade direction.
Take Profit
Traders may choose to exit positions at predetermined support or resistance areas. Another approach is to wait for an opposite crossover of the 50-period and 200-period EMA to signal a trade exit.
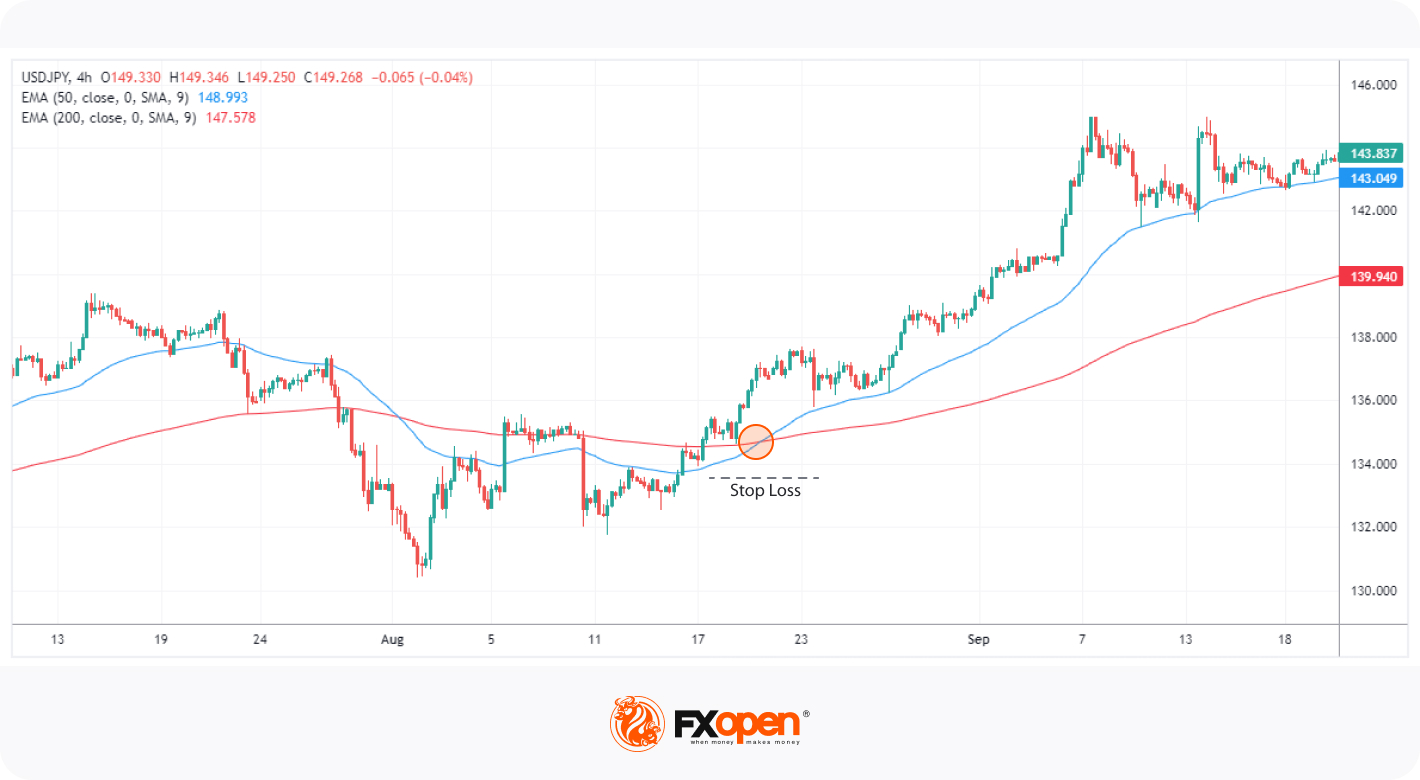
Above is a chart of the USD/JPY currency pair when the US interest rate was 2.5% and Japan's rate was -0.1%. Given this rate differential, a long-term appreciation of the pair was expected. On a 4-hour chart, a pullback occurred, and a subsequent crossover of the 50-period and 200-period EMA confirmed the long-term bullish bias. An entry would typically be considered at this point.
Algorithmic Trading and Quantitative Analysis
The advent of sophisticated algorithms has given rise to various automated trading strategies, including those that leverage hybrid approaches. Algorithmic trading strategies can execute a range of actions, from simple buy and sell triggers to complex portfolio rebalancing, all based on predefined criteria that could involve both FA and TA.
For traders who seek a statistical edge, quantitative trading strategies employ complex mathematical models to scrutinise numerous variables, often incorporating elements from both FA and TA. Moreover, advancements in AI algorithmic trading have enabled the creation of self-learning models that adapt to market conditions, further optimising trade execution and risk management. These algorithmic solutions offer a level of efficiency and precision that is difficult to achieve manually.
The Bottom Line
In summary, mastering multiple forms of analysis offers traders a holistic approach to navigating financial markets. No matter what trading approach you follow, be it scalping, swing trading, or trend following, a hybrid strategy is a worthy consideration. To take the first step in implementing these comprehensive trading methods, consider opening an FXOpen account to gain access to a wealth of resources and tools. Happy trading!
*At FXOpen UK and FXOpen AU, Cryptocurrency CFDs are only available for trading by those clients categorised as Professional clients under FCA Rules and Professional clients under ASIC Rules, respectively. They are not available for trading by Retail clients.
This article represents the opinion of the Companies operating under the FXOpen brand only. It is not to be construed as an offer, solicitation, or recommendation with respect to products and services provided by the Companies operating under the FXOpen brand, nor is it to be considered financial advice.
Stay ahead of the market!
Subscribe now to our mailing list and receive the latest market news and insights delivered directly to your inbox.


Latest articles

Weekly Market Insights with Gary Thomson: The Week of Central Banks and Earnings
In this video, we’ll explore the key economic events and market trends, shaping the financial landscape. Get ready for insights into financial markets to help you navigate the week ahead. Let’s dive in!
In this episode of Market

Intel at a Crossroads: Earnings Beat Meets Technical Resistance
Intel has just delivered its strongest quarter in over fifteen years, and the market reaction says it all. Q2 2026 revenue surged 25% year-over-year to $16.1 billion, crushing the consensus estimate of $14.42 billion, while adjusted EPS of

Tesla: Complex Range Structure Breaks Down Following Quarterly Earnings
Tesla released its Q2 2026 results after the market closed on 22 July. Revenue increased 26% year-on-year to $28.24 billion, while vehicle deliveries reached a record 480,126 units. However, operating margin fell sharply to 1.4%, down from