


How to Trade with the 5-0 Pattern
FXOpen

The 5-0 pattern is a relatively new harmonic trading formation revealed by Scott Carney in 2007. It is a reversal setup signalling a change in the direction of the market trend. In this FXOpen article, you will learn more about the 5-0 formation and why it’s worth spotting it on a chart. You’ll find out how to trade it effectively and see a real-market example of the 5-0 setup placed on the TickTrader platform.
What Is the 5-0 Harmonic Pattern?
The 5-0 is a harmonic pattern consisting of five points: X, A, B, C, and D. These form two interlocking features: an AB=CD pattern and a 50% BC retracement. The AB=CD model is composed of two legs (AB and CD) of equal length, linked by a BC retracement. The BC leg projects to point D, in line with the AB leg.
Unlike other harmonic patterns, it does not require a specific alignment of Fibonacci ratios in every case – it is sufficient that it falls within the appropriate range. Like most patterns, the 5-0 formation can be bullish and bearish, depending on the prevailing trend.
Bullish 5-0 Pattern
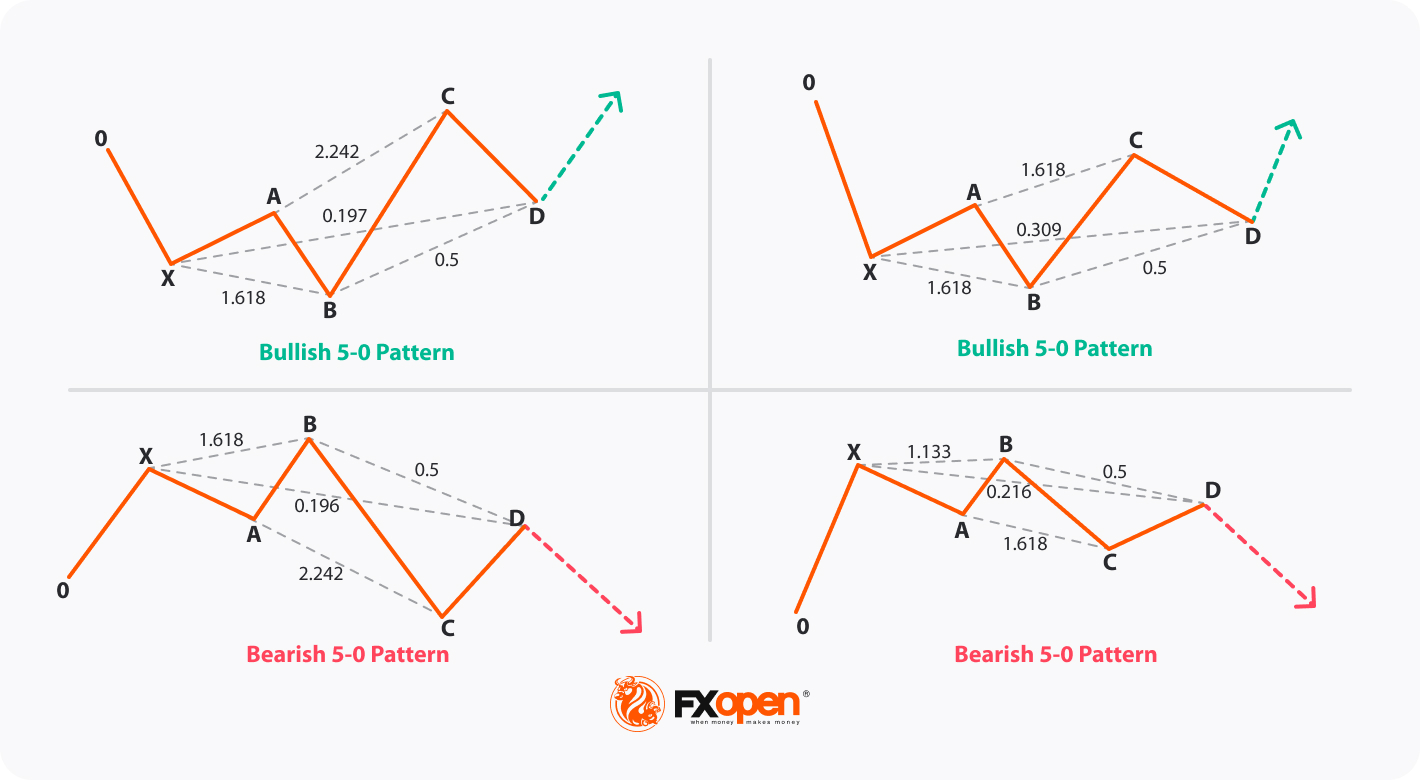
A bullish 5-0 setup represents a potential reversal of a downtrend. It starts with a downward impulse (0X) followed by an upward correction (XA). Then, the price reverses and forms a downward AB line.
Next, the price resumes the uptrend and forms an upward BC line. Finally, the price reverses again and forms a downward CD line, which is equal in length to the AB and completes the AB=CD formation. In addition, the 50% retracement of BC should coincide with D, which should also form above X.
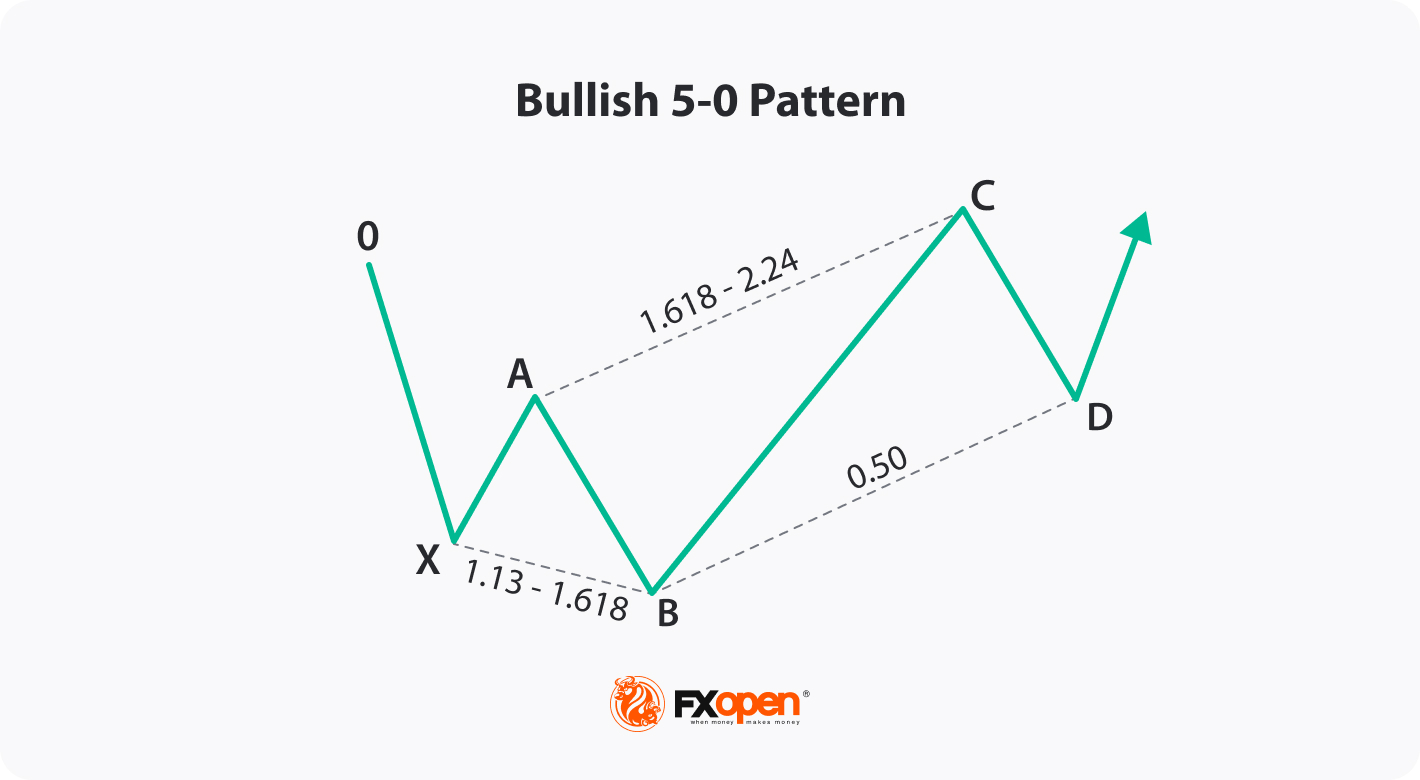
The completion of the bullish 5-0 pattern indicates that the sellers have exhausted their momentum, and the buyers are ready to take over. Therefore, traders look for buying opportunities near D, expecting a rally in the direction of the XA.
Bearish 5-0 Pattern
A bearish 5-0 setup represents a potential reversal of an uptrend. It starts with an upward impulse (0X) followed by a downward correction (XA). Then, the price reverses and forms an upward AB line.
Next, the price resumes the downtrend and forms a downward BC. Finally, the price reverses again and forms an upward CD line, which is equal in length to the AB and completes the AB=CD formation. In addition, the 50% retracement of BC should coincide with D, which should also form below X.

The completion of the bearish 5-0 pattern indicates that the buyers have exhausted their momentum and that the sellers are ready to take over. Therefore, traders look for selling opportunities near D, expecting a drop in the direction of the XA leg.
How to Spot a 5-0 Pattern
The theory sets out the following steps to spot a 5-0 setup on a chart:
Identify an extended price move. The 0 point will serve as the starting point, and X is the end of this initial move. OX is typically an impulse move.

Identify point A at the end of the retracement from X. The XA structure should ideally form an impulse move.
Draw a Fibonacci tool from X to A to identify point B. It should be between 1.13 and 1.618 Fibo extension of the XA leg.

Draw a Fibo line from A to B. The BC leg, which follows, should be the longest of the structure and should extend between the 1.618 and 2.24 Fibo levels of the AB leg. If the BC leg doesn't reach a 1.618 extension of the AB leg, the pattern is not valid.
After the BC leg has reversed, measure a 50% Fibonacci retracement from point B to point C. This defines point D.

The AB should ideally be equal in length to the CD leg and should extend from point C (forming AB=CD). Check if D lies above X for a bullish 5-0 pattern or below X for a bearish 5-0 pattern.
If all these conditions are met, you have identified a valid 5-0 formation on the chart. You can use any timeframe and trading instrument to spot the 5-0 as long as there is enough price data to form the five points.
Examples of the 5-0 setup
You can use the TickTrader trading platform to identify and draw the 5-0 setup for free.
5-0 Pattern Trading
Once you have spotted a 5-0 pattern on the chart, you may want to use the following rules to apply the 5-0 pattern to your trading.
Entry
The entry point for the 5-0 is at D, where the AB=CD pattern and the 50% retracement of BC converge. This is where the reversal of the trend is most likely to occur. The theory states that traders can enter a long position for a bullish 5-0 pattern or a short position for a bearish 5-0 pattern as soon as the price reaches D or wait for a confirmation signal such as a candlestick formation, a breakout, or an indicator crossover.
Stop Loss
The stop loss for the 5-0 pattern may be placed beyond X, which is the extreme point of the setup. This is where the reversal of the trend is invalidated, and the risk of further losses is high.
Take Profit
The take profit for the 5-0 is based on the Fibonacci extension of the CD leg. The most common targets are the 38.2%, 50%, and 61.8% extensions, which correspond to the potential retracement levels of the new trend. Traders tend to choose one of these targets or use a trailing stop to lock in profits as the price moves in their favour.
Real-Market Example
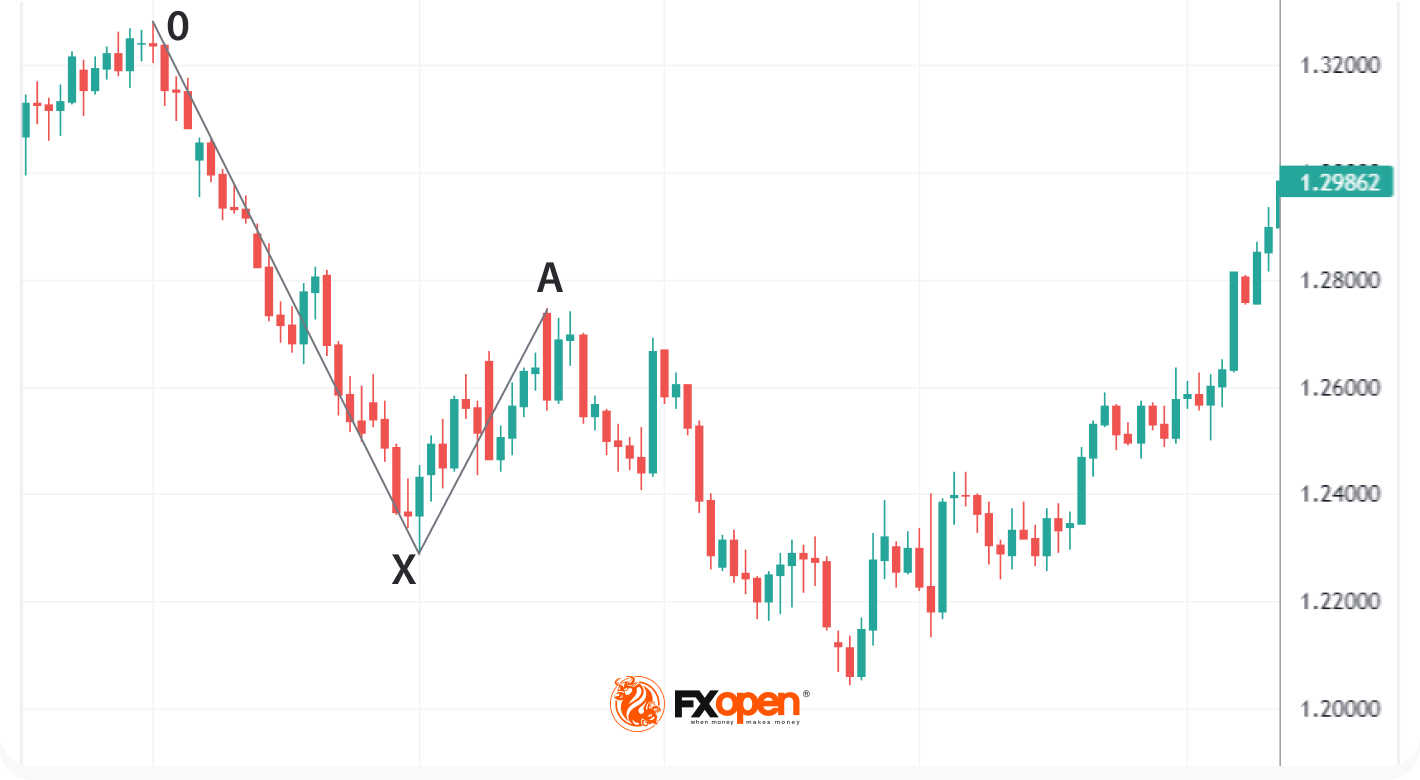
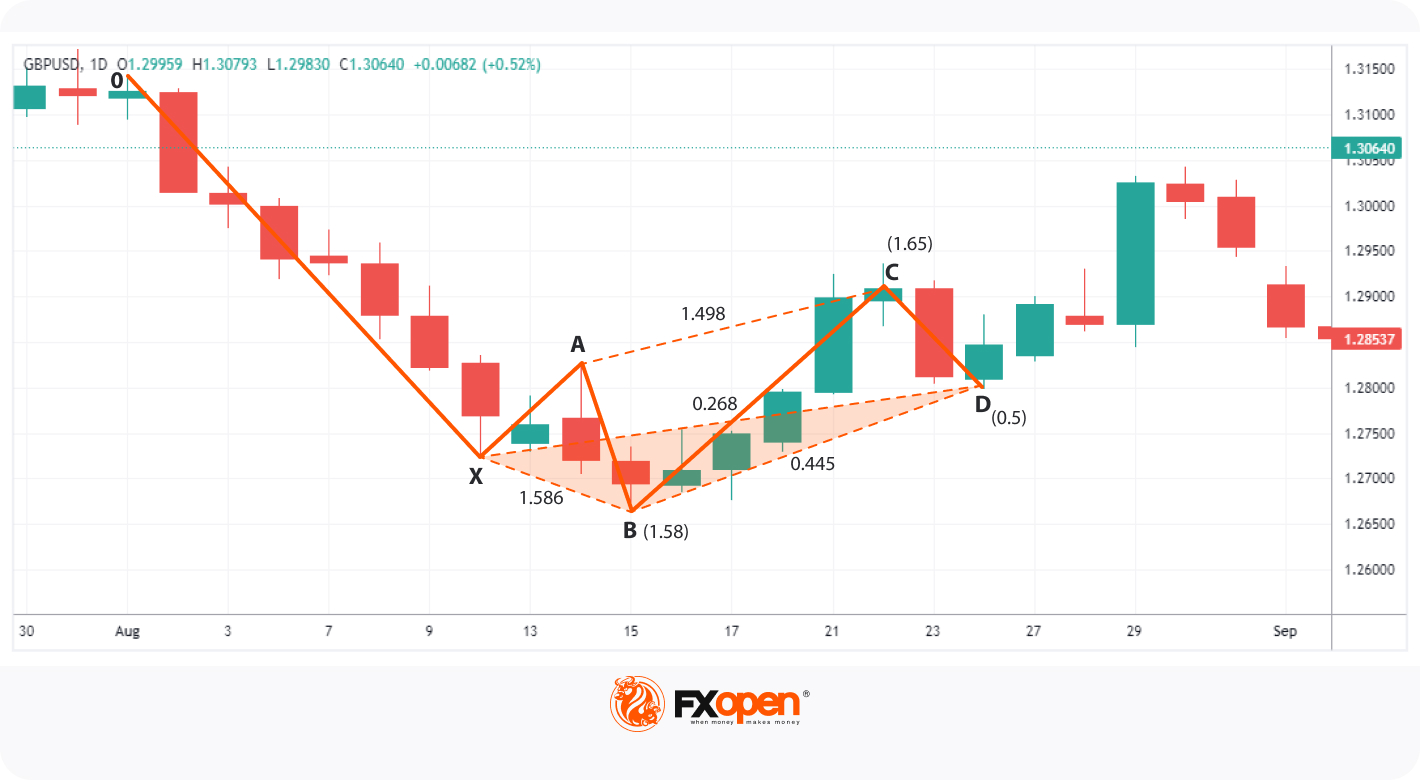
Let's look at an example of a bullish 5-0 pattern on the GBP/USD daily chart:
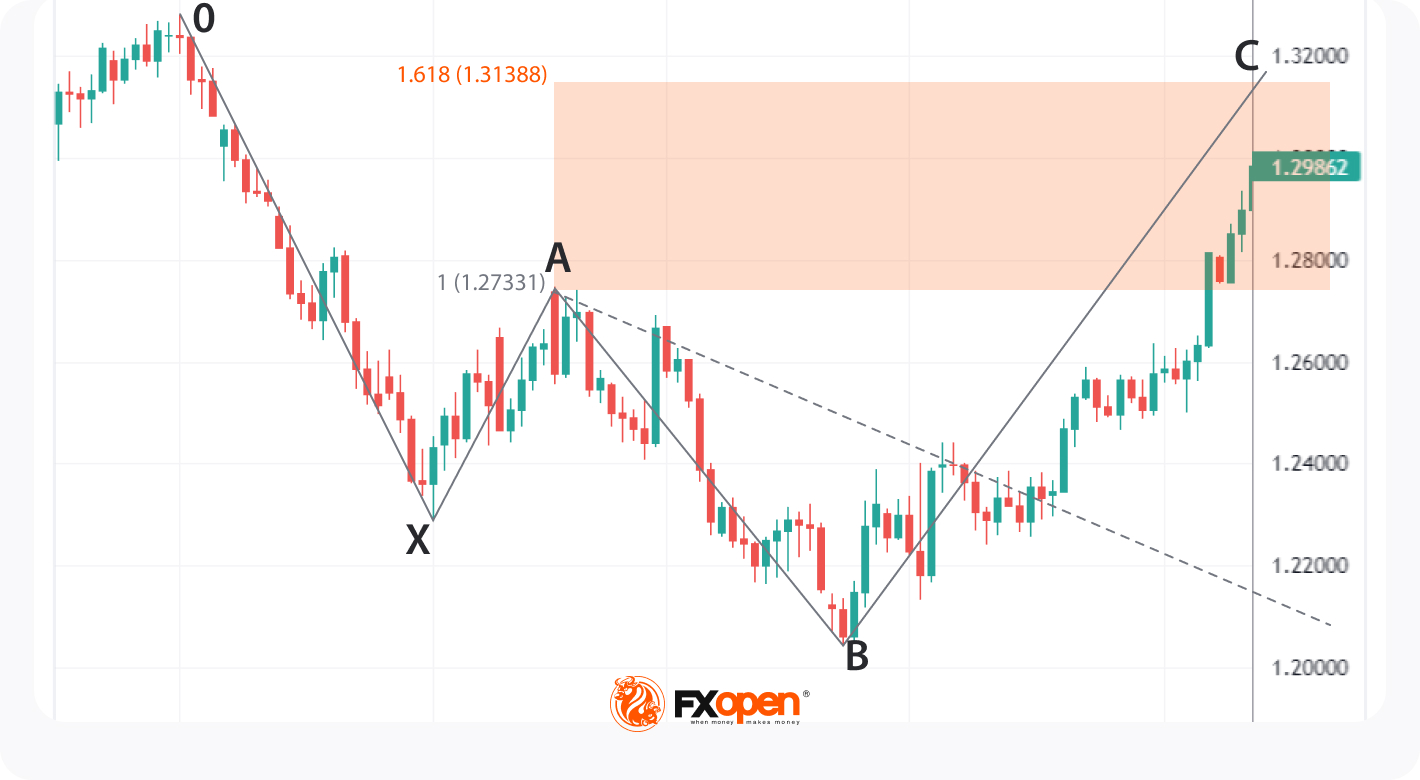
As you can see, the price formed a downward 0X from 1.3145, followed by an upward XA impulse. Next was AB, which extended 158.62% of XA. Then, the price formed an upward BC that expanded at 1.65 of the AB and a downward CD that was equal in length to the AB (AB=CD pattern). The 50% retracement of BC overlapped with D, which was above X. These conditions confirmed a valid bullish 5-0 setup on the chart.
A trader could have entered a long position at D, with a stop loss below X and a take profit at the 50% Fibonacci extension of the CD. The trade would have been profitable as the price rallied to reach the target within the following days.
Conclusion
According to its creator, Scott Carney, the 5-0 is a unique technical formation directly linked with Fibonacci ratios. Still, it may provide incorrect signals or be misinterpreted. Therefore, it’s worth practising spotting it on charts on different timeframes.
If you want to learn more about 5-0 harmonic trading, check out the free educational materials on our website or open an FXOpen account and try them in a real-life market.
This article represents the opinion of the Companies operating under the FXOpen brand only. It is not to be construed as an offer, solicitation, or recommendation with respect to products and services provided by the Companies operating under the FXOpen brand, nor is it to be considered financial advice.
Stay ahead of the market!
Subscribe now to our mailing list and receive the latest market news and insights delivered directly to your inbox.


Latest articles

Ripple: Letter to Congress Stirs the Crypto Market
At the beginning of June, more than 200 crypto companies and industry groups — including Coinbase, Andreessen Horowitz and Ripple Labs — sent a letter to Senate Majority and Minority Leaders John Thune and Chuck Schumer, urging them to bring the Digital

GBP/JPY: Ascending Triangle Under Pressure
The GBP/JPY pair has come under pressure after the Bank of Japan raised its policy rate to 1.0% on 16 June. The Bank of England is following the opposite path: at its 30 April meeting, the Monetary Policy

Pound Under Pressure: Markets Await Bank of England And SNB Decisions
The British pound remains under pressure following weaker-than-expected inflation data, which has reinforced expectations of further monetary easing by the Bank of England. Investors are staying cautious ahead of today’s policy meetings of both the UK central bank and