


The ABCD Trading Pattern: Spotting Market Reversal
FXOpen

The ABCD trading pattern is a popular harmonic formation used by traders across forex, stock, and commodity markets. Understanding how this pattern develops may help traders anticipate price movements and build their entry strategy. Let’s explore the structure of the ABCD pattern, its Fibonacci ratios, and how traders apply it to trading.
What Is an ABCD Pattern?
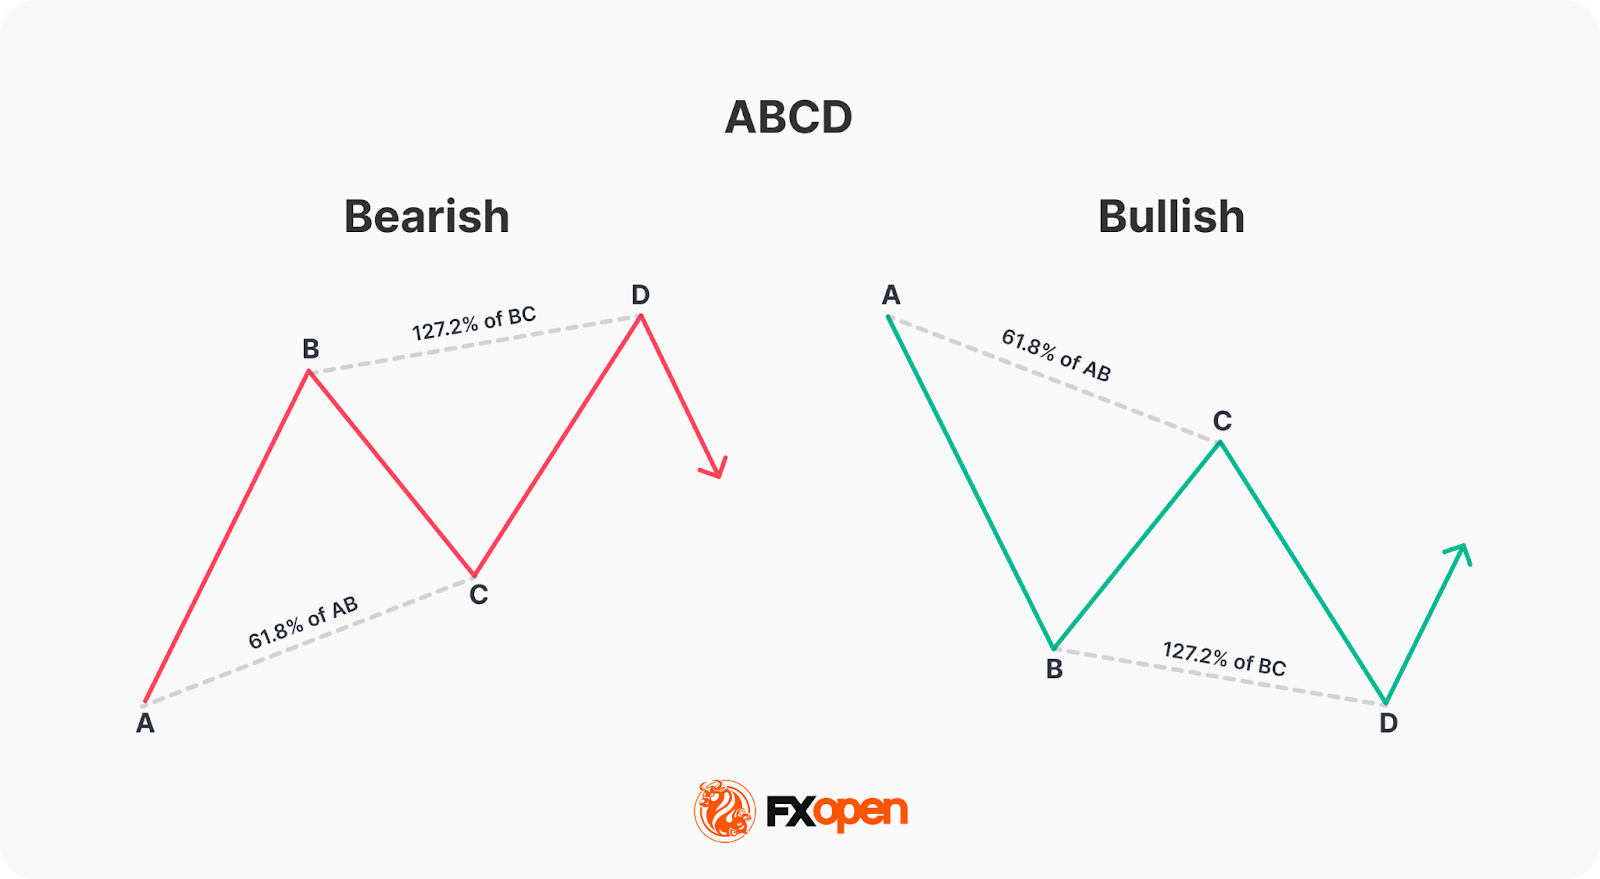
The ABCD pattern is one of the basic harmonic patterns. It gives traders an idea of where the market might reverse. The ABCD comprises two legs, AB and CD, and one retracement, BC, with D as an entry point. More specifically, an ABCD can be identified by:
- AB Leg: A trend starts at A and makes a high or low at B.
- BC Retracement: The price retraces from B to C.
- CD Leg: The trend continues from C to D.
- D Entry Point: Once another high or low forms and traders enter at D.
These price movements create the “zig-zag” or “lightning bolt” shapes.
In fact, ABCD patterns are present across every market and every timeframe. Therefore, when combined with other forms of technical analysis, it may be a valuable addition to your trading arsenal.
Why Do Traders Use the ABCD Pattern in Their Trading Strategy?
Before we move on to identifying and trading the ABCD pattern, it’s worth explaining why you might want to consider using it. Here are a few reasons traders favour the ABCD pattern:
- It’s one of the harmonic patterns popular among traders of all experience levels.
- It’s versatile and works for stocks, commodities, and cryptocurrencies*, not just forex trading.
- Traders use ABCD patterns to make decisions about potential turning points in the market.
- It can form the basis of a working trading strategy if used correctly alongside other forms of technical analysis.
- It could provide a fairly efficient risk/reward ratio if reversals are caught.
How Traders Identify an ABCD Trading Pattern
The first step in finding ABCDs is to look for that classic zig-zag shape. Once you’ve found one, it’s time to apply Fibonacci ratios to confirm the pattern. If you’re struggling, you can consider using pre-made ABCD pattern indicators or scanners to help your eyes get used to spotting them. You can find one in the TickTrader trading platform by FXOpen.
The ABCD pattern requires that the BC leg is between a 38.2% to 78.6% retracement of AB, ideally between 61.8% and 78.6%. This means that if you put a Fibonacci retracement tool at A and B, C should be between 0.382 and 0.786.
The second CD leg should be a 127.2% to 161.8% extension of the BC retracement. For extra confirmation, consider specifying that AB is equal to the same length as CD.
While it can be tempting to start trading based on these conditions, you’ll find that, in practice, identifying point D can be trickier than it seems. That’s why traders typically use Fibonacci ratios, key levels, candlestick patterns, and higher timeframe convergence to confirm their entries, which we will touch on shortly.
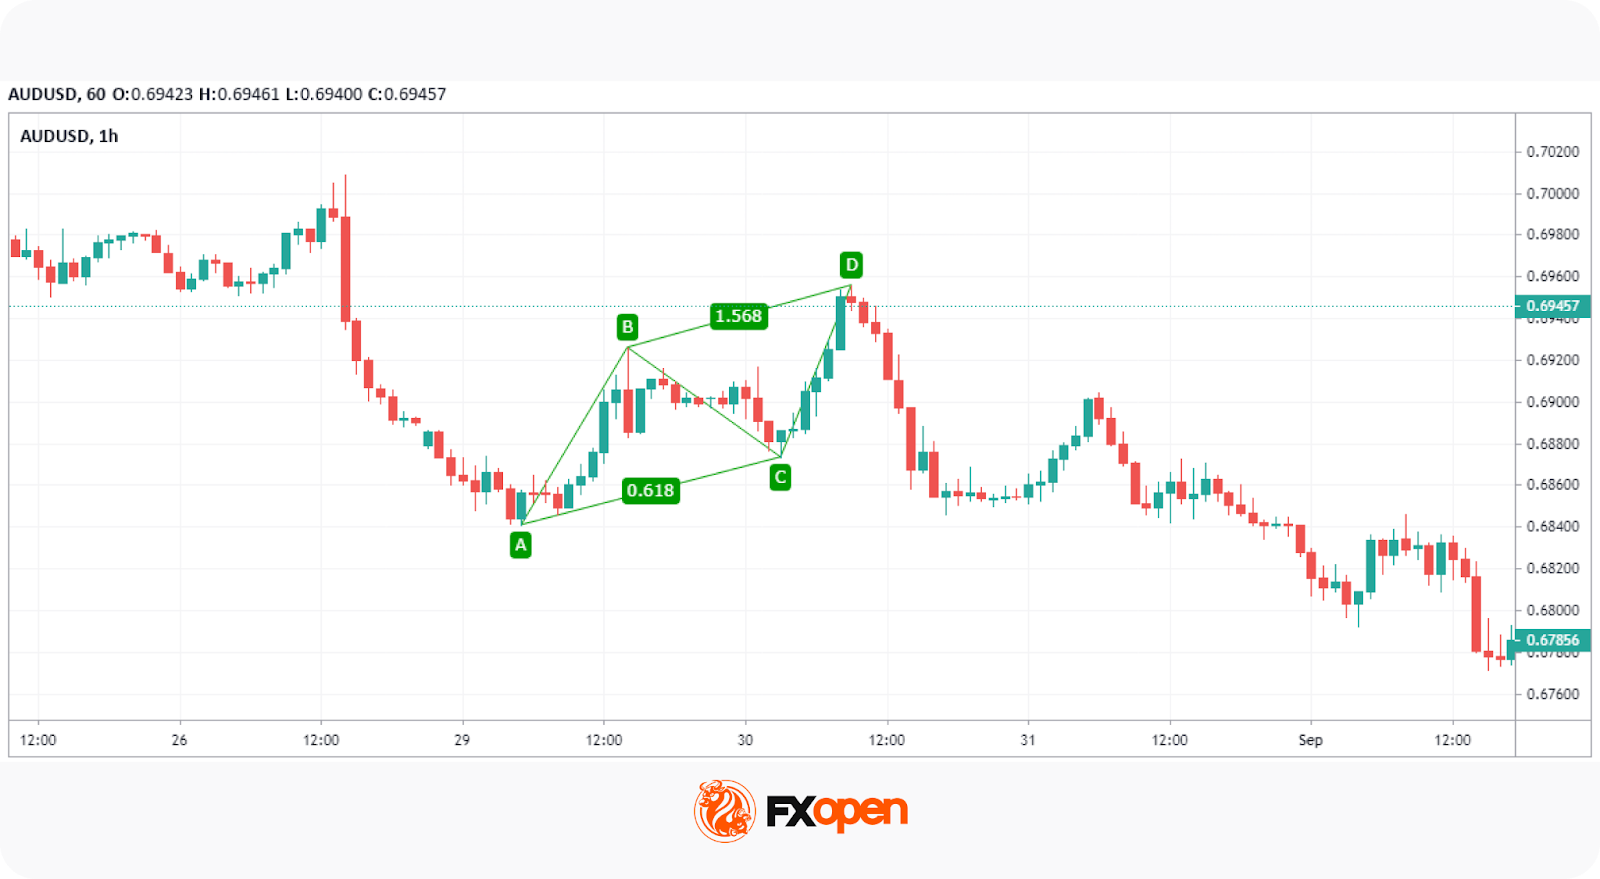
ABCD Pattern Examples
Now that we understand how to identify the ABCD pattern, we can start applying it to real price action. If you want to follow along, you can consider using the FXOpen TickTrader platform. There you can use the built-in ABCD drawing tool that automatically calculates the Fibonacci ratios between points.
Note that the ratios won’t always be perfect, so allowing for slight variability above or below the defined ratios is acceptable.
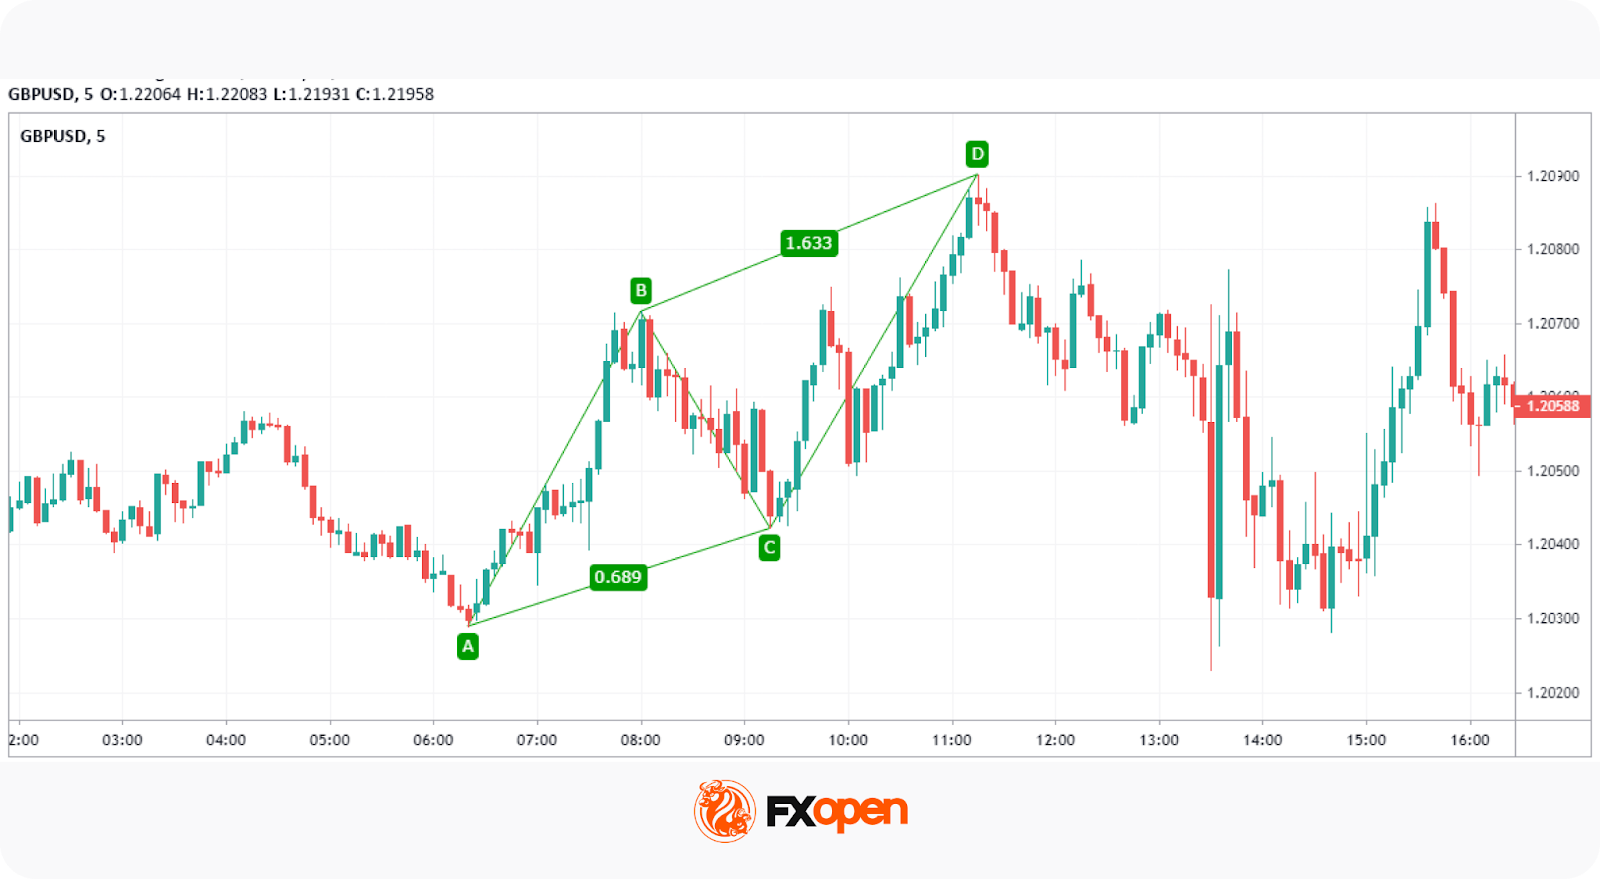
Bullish ABCD Pattern
For a bullish formation, the following must be present:
- The AB leg should be between the high A and low B.
- The BC bullish retracement should be between the low B and high C, which is below the high A.
- The CD leg should be between the high C and low D.
- BC is a 38.2% to 78.6% retracement of AB, preferably between 61.8% and 78.6%.
- CD is a 127.2% to 161.8% extension of BC.
Additionally, you may look for AB to be an identical or similar length to CD.
According to theory:
Entry: Traders set a buy order at D.
Stop Loss: Traders set a stop below a nearby support level or use a set number of pips.
Take profit: Traders place take-profit orders at the 38.2%, 50%, or 61.8% retracement of CD or hold for higher prices if they believe there’s the potential for further bullishness.
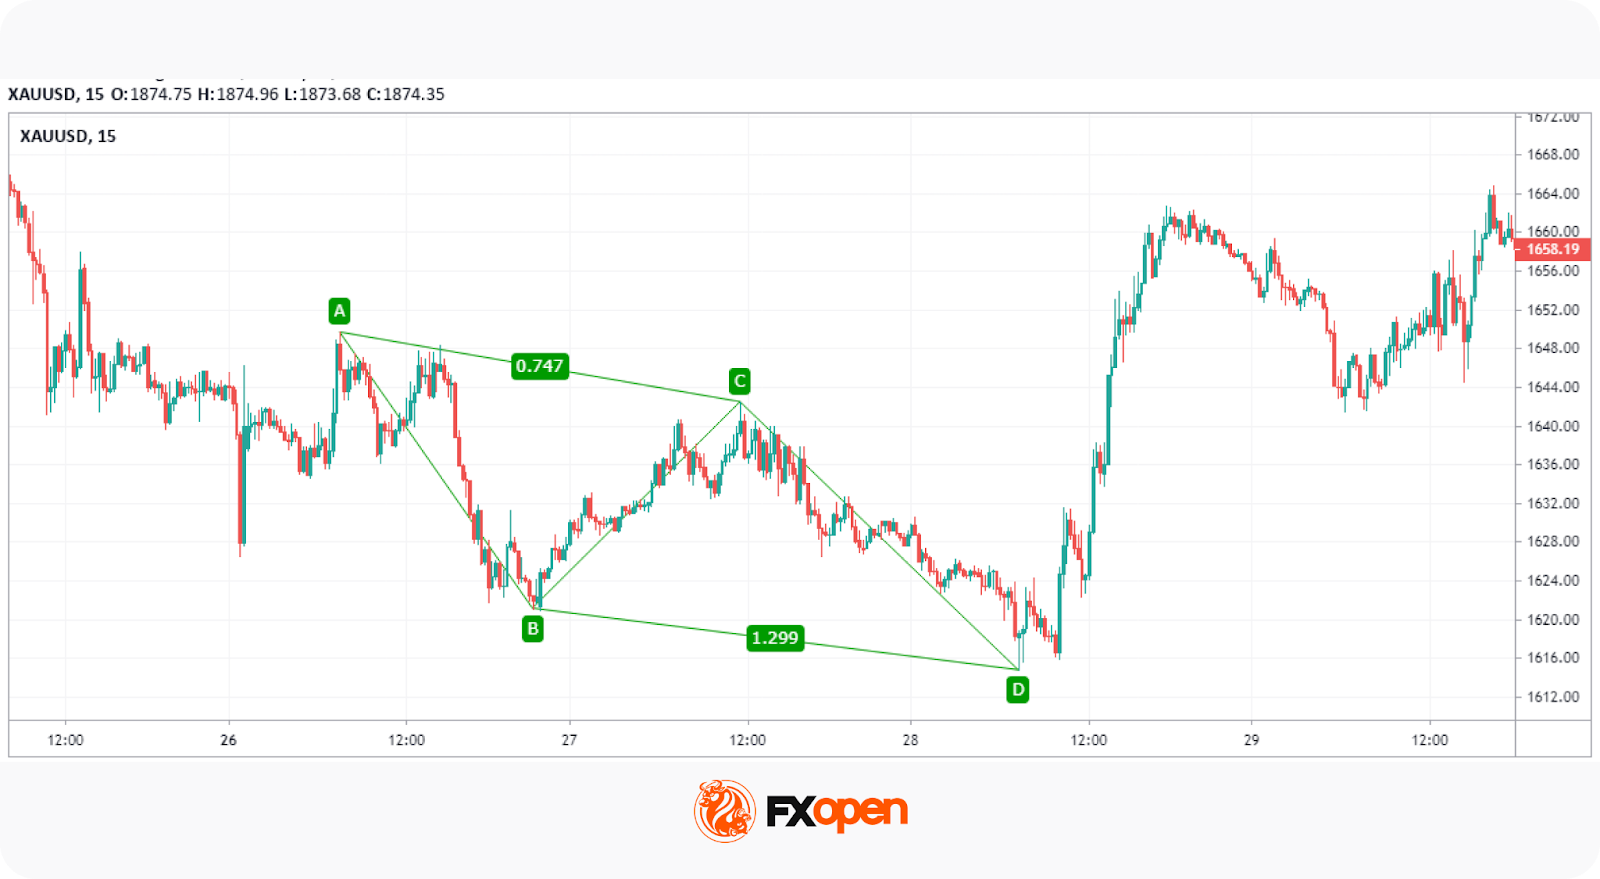
Bearish ABCD Pattern
The bearish ABCD chart pattern is essentially the same, just with the reversed highs and lows. As such:
- The AB leg should be between the low A and high B.
- The BC bearish retracement should be between the high B and low C.
- The CD leg should be between the low C and high D.
- BC is a 38.2% to 78.6% retracement of AB, preferably between 61.8% and 78.6%.
- CD is a 127.2% to 161.8% extension of BC.
You can choose to apply the same AB = CD rules in a bearish ABCD pattern if desired.
According to theory:
Entry: Traders typically place a sell order at D.
Stop Loss: A stop may be placed above a nearby resistance level or at a set number of pips.
Take profit: Traders often take profits at the 38.2%, 50%, or 61.8% retracement of CD or hold for lower prices if there’s a bearish trend on a higher timeframe.
ABCD Pattern Strategy
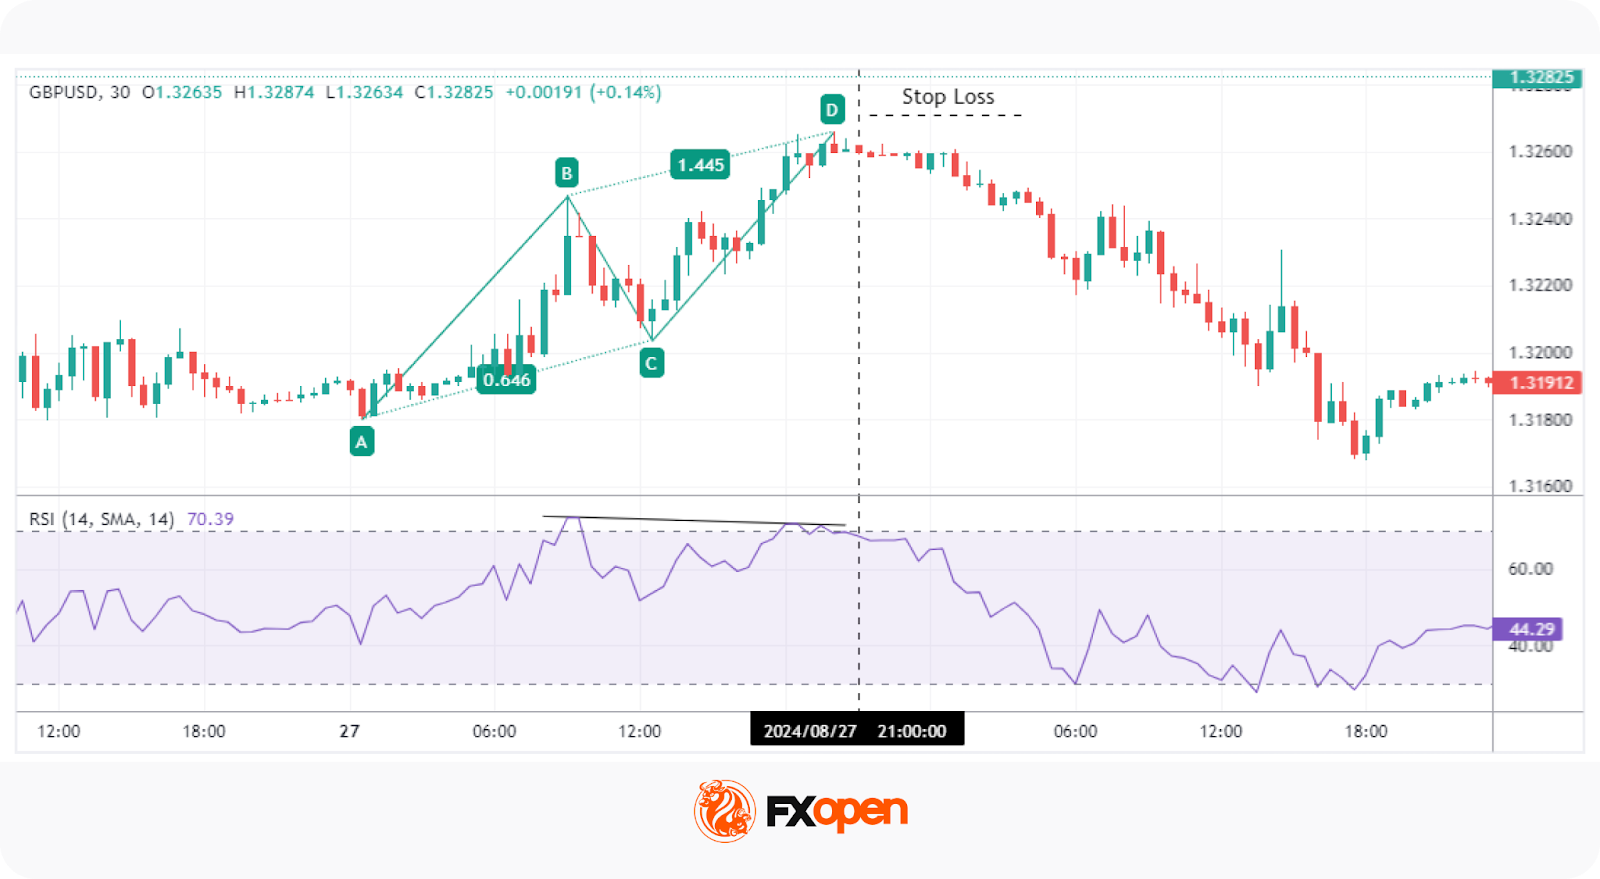
A momentum-based ABCD trading strategy may help traders confirm potential reversals by incorporating indicators like the RSI (Relative Strength Index). This approach often adds an extra layer of confluence.
Entry
- Traders may wait for point D to form and for the RSI to indicate overbought or oversold conditions, typically above 80 or below 20.
- Additional confirmation can be sought if there is a divergence between price and RSI, signalling weakening momentum.
- Once the RSI crosses back into normal territory, it can suggest a reversal.
Stop Loss
- A stop loss is often placed slightly above or below point D, depending on whether the formation is bearish or bullish, respectively.
Take Profit
- Traders can consider placing take-profit orders at Fibonacci retracement levels of leg CD, such as 38.2%, 50%, or 61.8%.
- Another common target is point C, but traders may also hold the position for longer if further price movement is anticipated.
Looking for Additional Confluence
Given that trading the ABCDs usually relies on setting orders at specific reversal points, consider looking for extra confirmation to filter potential losing trades. Below, you’ll find three factors of confluence you can use to confirm your entries.
Key Levels
If your analysis shows that D is projected to be in an area of significant support or resistance, this alignment may suggest that the level will hold and the price will move in the anticipated direction.
ABCD Timeframe Convergence
Another technique is to check for multiple timeframes. When you identify the formation on a lower timeframe—say, the 5-minute chart—you can then look to a higher timeframe chart, such as the 30-minute or 1-hour chart to see the overall trend.
If the pattern converges with the longer-term trend, it is supposed to strengthen the analysis.
Candlestick Patterns
Some traders look for particular candlestick patterns to appear. The hammer and shooting star patterns are commonly used by ABCD traders for extra confirmation, as are tweezer tops/bottoms and engulfing candles. You could choose to wait for one of these candlesticks to form before entering with a market order.
Common Mistakes to Avoid When Identifying an ABCD Chart Pattern
Of course, ABCD patterns aren’t a silver bullet when it comes to trading. There are several common mistakes made by inexperienced traders when trading these types of patterns, such as:
- Confusing the ABCD with other harmonic patterns, like the Gartley or three-drive pattern.
- Trading every potential ABCD formation they see. It’s preferable to be selective with entries and look for confirmation.
- Not being patient. ABCDs on higher timeframes can take days, even weeks, to play out. Experienced traders wait for the pattern to develop before making a trading decision.
- Ignoring key levels. Instead, you could allow them to guide your trades and look for the ABCD pattern in these areas.
The Bottom Line
The ABCD pattern is a versatile tool that may support traders in identifying potential market reversals and building their strategies. When combined with other forms of technical analysis, such as momentum indicators, an ABCD trading strategy can be an invaluable addition to a trading arsenal.
If you are looking to apply the ABCD pattern in forex, stock, commodity, or crypto* CFD markets, you can consider opening an FXOpen account and gain access to low-cost trading across more than 700 assets. Good luck!
FAQ
What Is an ABCD Trading Pattern?
The ABCD trading pattern is a simple harmonic pattern used by traders to identify potential market reversals. It consists of three price movements: the AB leg, BC retracement, and CD leg, with point D marking a potential entry for a reversal trade. It may help identify changes in trend direction.
How Could You Use the ABCD Pattern in Trading?
Traders identify the ABCD pattern by finding the characteristic zig-zag shape and using Fibonacci ratios to confirm it. Entry points are typically placed at point D, with stop losses and profit targets based on the formation’s structure. Confluence with other technical analysis tools may confirm its signals.
Is the ABCD Pattern Bearish or Bullish?
The ABCD pattern can be either bearish or bullish. A bullish ABCD indicates a potential upward reversal, while a bearish ABCD suggests a downward reversal. The structure remains the same, but the highs and lows are reversed.
What Is the ABCD Strategy?
The ABCD strategy revolves around identifying trend reversals using the formation and confirming entry points through tools like Fibonacci retracements or momentum indicators like the RSI for added accuracy.
*Important: At FXOpen UK, Cryptocurrency trading via CFDs is only available to our Professional clients. They are not available for trading by Retail clients. To find out more information about how this may affect you, please get in touch with our team.
This article represents the opinion of the Companies operating under the FXOpen brand only. It is not to be construed as an offer, solicitation, or recommendation with respect to products and services provided by the Companies operating under the FXOpen brand, nor is it to be considered financial advice.
Stay ahead of the market!
Subscribe now to our mailing list and receive the latest market news and insights delivered directly to your inbox.


Latest articles

Weekly Market Insights with Gary Thomson: The Week of Central Banks and Earnings
In this video, we’ll explore the key economic events and market trends, shaping the financial landscape. Get ready for insights into financial markets to help you navigate the week ahead. Let’s dive in!
In this episode of Market

Intel at a Crossroads: Earnings Beat Meets Technical Resistance
Intel has just delivered its strongest quarter in over fifteen years, and the market reaction says it all. Q2 2026 revenue surged 25% year-over-year to $16.1 billion, crushing the consensus estimate of $14.42 billion, while adjusted EPS of

Tesla: Complex Range Structure Breaks Down Following Quarterly Earnings
Tesla released its Q2 2026 results after the market closed on 22 July. Revenue increased 26% year-on-year to $28.24 billion, while vehicle deliveries reached a record 480,126 units. However, operating margin fell sharply to 1.4%, down from