


FXOpen
The Commodity Channel Index (CCI) is a popular technical indicator that is widely used by traders and investors to analyse price movements in financial markets, such as stocks, commodities, forex, and cryptocurrencies*. What is the CCI indicator? In this FXOpen article, we will tell you how to read its signals, which settings work the best for it, and why it can’t be replaced with the stochastic oscillator.
What Is the Commodity Channel Index?
The Commodity Channel Index (CCI) was created by Donald Lambert in the 1980s for commodity analysis only. However, today the CCI is used in different financial markets, including forex, stock, index, and cryptocurrencies*, to identify potential trend reversals, generate buy or sell signals, and determine overbought or oversold conditions.
The CCI is an oscillator, and like all oscillators, it’s placed below the price chart and consists of a line that fluctuates within a particular range. The standard CCI range is from -100 to 100, where exceeding readings are considered anomalies that allow traders to catch trading signals. The 0 point is also crucial as it serves as a barrier between the up and downtrend. In general, the index is used to assess price direction and strength.
How to Calculate the CCI
The CCI evaluates the current asset price level in terms of its historical average. It is calculated using a mathematical formula that takes into account the average price, typical price, and mean deviation.
The CCI formula is:
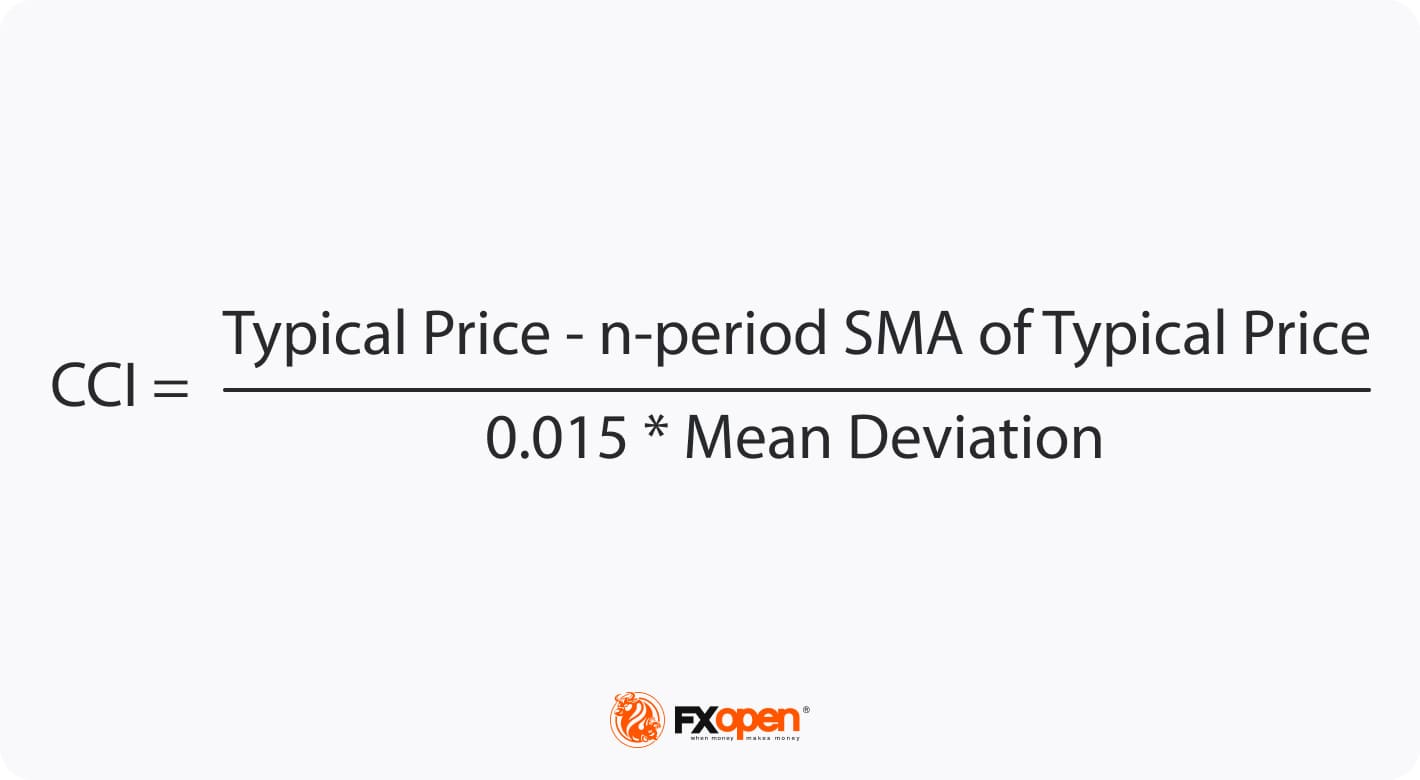
Where:
- Typical Price = (High + Low + Close) / 3
- Mean Deviation = Average of the absolute differences between the Typical Price and its Simple Moving Average
- 0.015 is a constant used to normalise the CCI values so that 70-80% of the index’s values move within the range from -100 to 100.
The default value for the number of periods used in CCI calculation is typically set to 20, but traders can adjust this value to suit their trading style. Shorter periods, such as 10 or 14, may provide more sensitive and frequent signals, suitable for shorter-term trading or scalping strategies. Longer periods, such as 50 or 100, may provide more reliable signals for longer-term trends or swing trading strategies.
However, these difficult calculations aren’t required when using the TickTrader platform, where all technical analysis tools are implemented automatically.
How to Use the CCI Technical Indicator
CCI can be used in various ways to analyse price movements and generate trading signals. Here are some common approaches when trading CCI.
Spotting Overbought and Oversold Conditions
Traders measure the relation of the current CCI value to its historical rate. When it is relatively high, it signals that the price is above its average; when it’s relatively low, the price is supposed to be below its average. Using this concept, traders can identify overbought or oversold conditions in a market.
Most of the time, the index moves within the -100-100 range. When it rises above +100, it may indicate that the asset is overbought. Conversely, when CCI falls below -100, it may indicate that the asset is oversold. Traders can use these overbought or oversold signals to enter or exit trades or to manage their existing positions as they suggest a potential price reversal or a pullback. Usually, when the price breaks below 100, a trader goes short, while when the price rises above -100, a trader goes long.
A significant pitfall when using the CCI is that it is unbound, so it can be challenging to identify when the price will reverse. For instance, when using a stochastic oscillator, traders know that when the oscillator is in the 0-20 zone, the market is oversold and may reverse in the near future. At the same time, the commodity channel index doesn’t have a limit and can fall to -200, -400, etc.
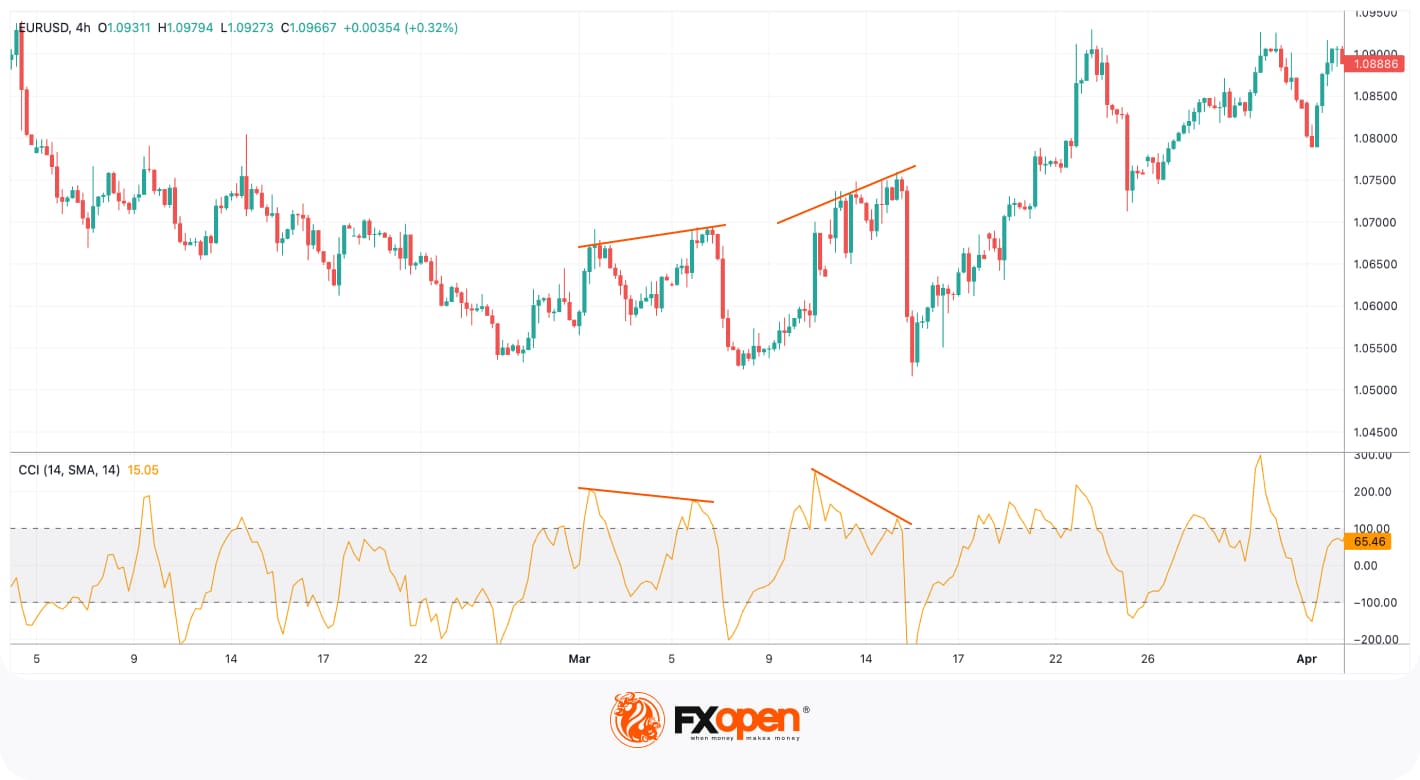
Detecting Divergence
Divergence occurs when the price and CCI move in opposite directions. Bullish divergence is a market condition when the price makes lower lows, but the index forms higher lows, suggesting a potential bullish reversal. On the other hand, bearish divergence appears when the price makes higher highs, but the index forms lower highs, suggesting a potential bearish reversal. Traders can use divergence signals as an early indication of potential trend changes and adjust their trading strategies accordingly.
The Commodity Channel Index and the Stochastic: Differences
The commodity channel index and the stochastic are popular momentum-based oscillators used in technical analysis. Both can be used to spot overbought and oversold market conditions, and detect divergence, so a trader can confirm trend reversals or continuations. At the same time, the stochastic consists of two lines – %K and %D – and their crosses can also generate buy and sell signals.
Also, due to their differences in scales and calculations, they may generate slightly different signals and may be more suitable for different trading styles.
One key difference is in their scales. CCI oscillates above and below a zero baseline, with positive and negative values above 100 and below -100, indicating overbought and oversold conditions, respectively. On the other hand, the Stochastic Oscillator has a bounded range between 0 and 100, with readings above 80 standing for overbought conditions and readings below 20 standing for oversold conditions.
Another difference is in how they are calculated. CCI is calculated based on the typical price, which is the average of the high, low, and close prices, and the mean deviation, which measures the variability of the price data. The Stochastic Oscillator is calculated based on the relationship between the current closing price and the range between the high and low prices over a certain period.
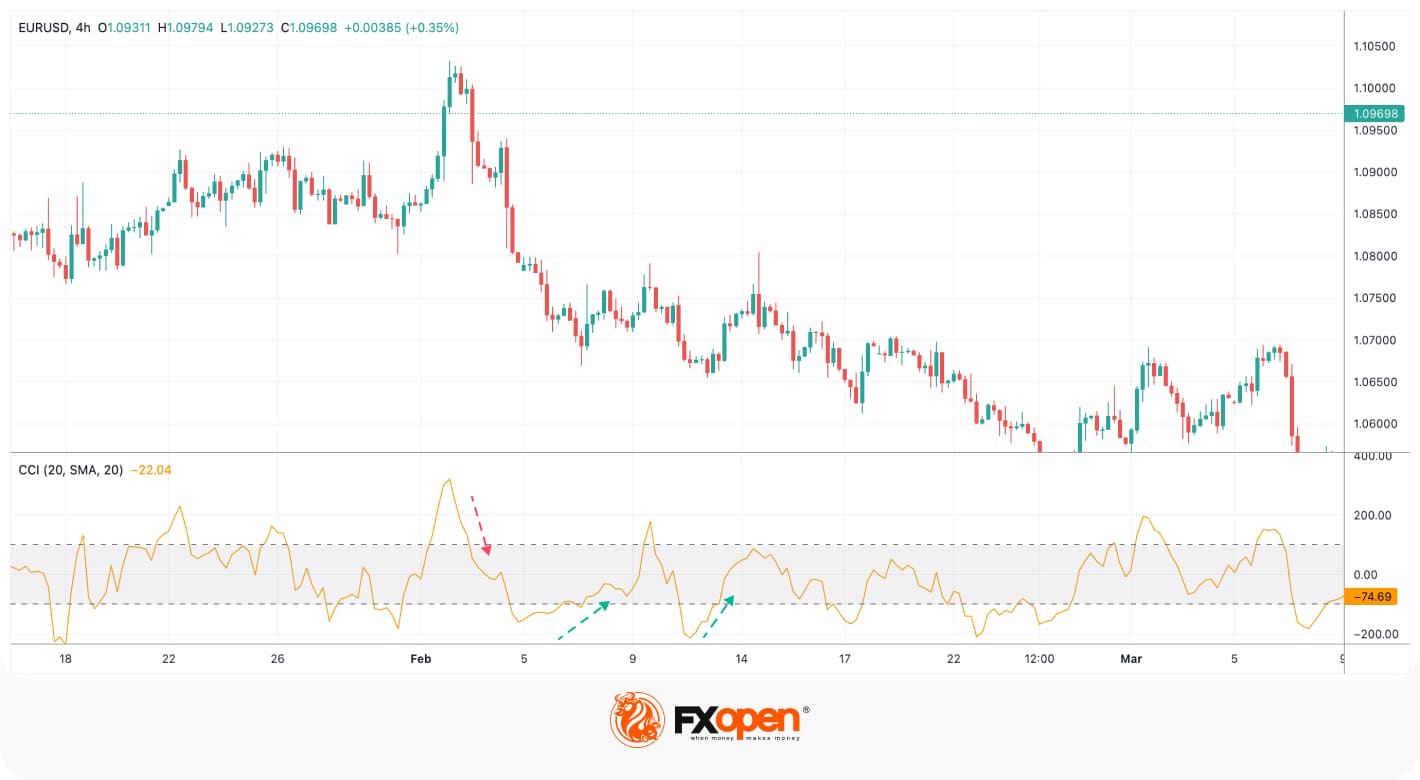
Let’s compare the signals on the real chart.
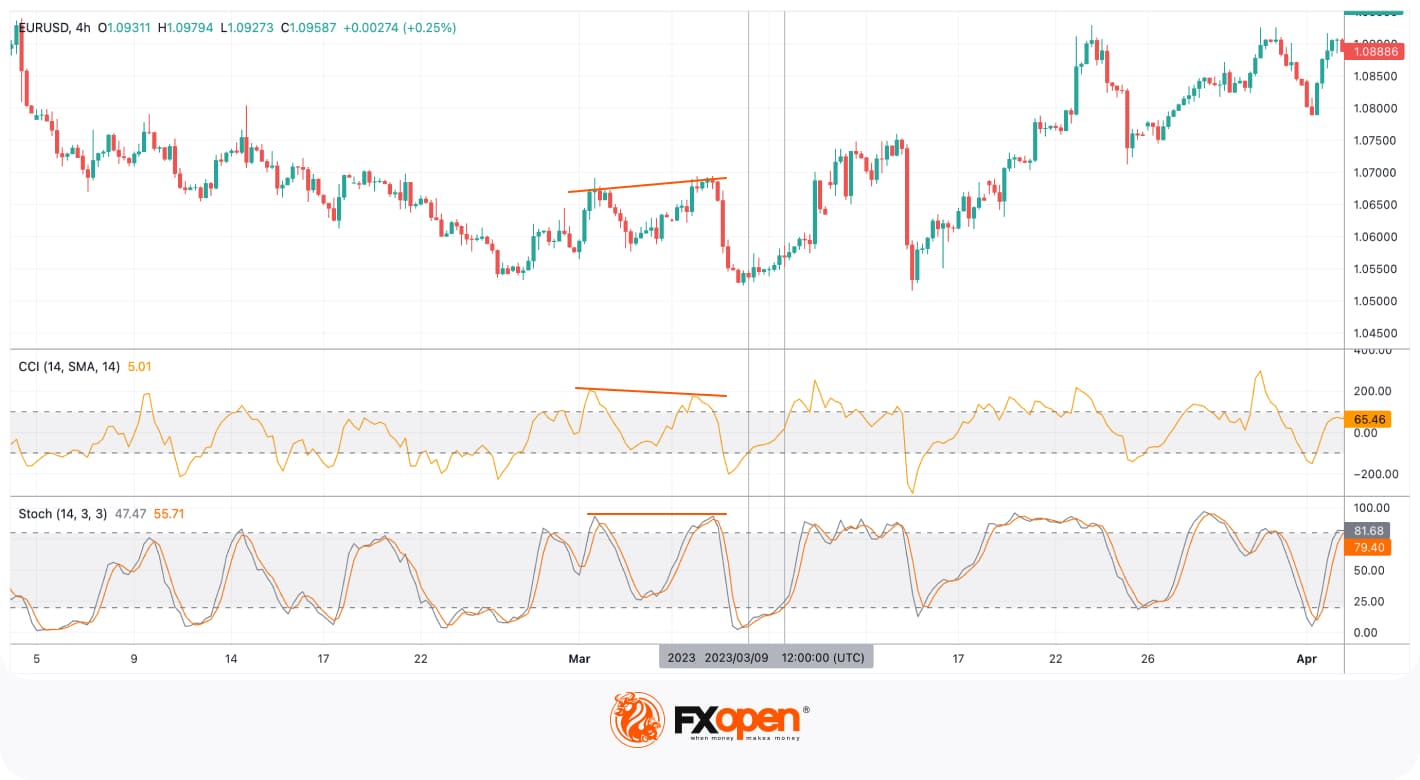
While the commodity channel index formed a bearish divergence with the price, the stochastic didn't. So, a trader could miss a potential entry point. The indicators reflected overbought and oversold market conditions similarly. Still, they returned to the average range at different times. In the chart above, the CCI broke above -100 earlier than the stochastic, so a trader could enter a buy trade earlier if they used the signal of the index.
This example doesn't show that the commodity channel index is more effective than the stochastic. The indicators should be adjusted to a specific timeframe with particular settings, and it's vital to evaluate price volatility before adding them to the chart.
More about the stochastic indicator you can read here.
Commodity Channel Index: Limitations
Like any technical indicator, the commodity channel index has some limitations that traders should be aware of when using it in their analysis.
- False Signals. CCI can generate false signals, especially in ranging or choppy markets. During periods of low volatility or when prices are moving sideways, CCI may generate overbought or oversold signals that do not result in meaningful price movements.
- Lagging Indicator. CCI is a lagging indicator, as it is based on historical price data. It may not provide timely signals for fast-moving markets or sharp trend reversals. Traders are aware of the lagging nature of CCI and use it in combination with other leading indicators or price action analyses to get a more comprehensive view of the market dynamics.
- Whipsawing. CCI can provide whipsaw signals, which are false signals that occur when prices quickly reverse direction after generating a signal. Whipsaw signals can result in losses for traders who enter trades based solely on CCI signals.
Final Thoughts
The commodity channel index (CCI) is a popular momentum-based oscillator that can provide insights into market conditions. It is a versatile indicator that can be used in different timeframes and markets, and it can be a valuable tool for traders to identify potential trading opportunities.
However, like any technical indicator, the commodity channel index has limitations, including false signals, a lagging nature, subjective interpretation, reliance on historical price data, whipsawing, and individual interpretation. Therefore, traders use CCI in conjunction with other technical and fundamental analysis tools to make informed trading decisions. After you learn how to implement the CCI into your trading strategy, you can open an FXOpen account to trade in live markets.
*At FXOpen UK and FXOpen AU, Cryptocurrency CFDs are only available for trading by those clients categorised as Professional clients under FCA Rules and Professional clients under ASIC Rules, respectively. They are not available for trading by Retail clients.
This article represents the opinion of the Companies operating under the FXOpen brand only. It is not to be construed as an offer, solicitation, or recommendation with respect to products and services provided by the Companies operating under the FXOpen brand, nor is it to be considered financial advice.
Stay ahead of the market!
Subscribe now to our mailing list and receive the latest market news and insights delivered directly to your inbox.


Latest articles


Market Insights with Gary Thomson: Oil, US Retail Sales & NFP in Focus
In this video, we’ll explore the key economic events and market trends, shaping the financial landscape. Get ready for insights into financial markets to help you navigate the week ahead. Let’s dive in!
In this episode of Market

Geopolitics Fuels Volatility: AUD/USD and USD/CAD Near Key Levels
Commodity-linked currencies continue to weaken amid rising geopolitical tensions, which are boosting demand for safe-haven assets and increasing volatility across both FX and commodity markets. The US dollar is gaining support from demand for liquid and defensive assets, while currencies