


How to Trade with the On-Balance Volume Indicator
FXOpen
Understanding volume in relation to price movement can be crucial for successful trading. The On-Balance Volume (OBV) indicator offers this valuable perspective by combining price and volume to gauge market sentiment. This article explains how to calculate, interpret, and apply the OBV in your trading strategies.
The On-Balance Volume Indicator Explained
The On-Balance Volume indicator is a momentum-based tool utilised to evaluate the flow of trading volume in relation to the asset's price movement. Conceived by Joseph Granville in 1963, the OBV operates on a straightforward premise: volume precedes price. This means that changes in trading volume can be a precursor to a forthcoming change in the price of an asset, be it a stock share, currency pair, or commodity.
Unlike many other indicators that focus solely on price movements, the OBV offers an additional layer of analysis by incorporating buying and selling activity. This holistic view allows traders to assess market sentiment and possibly forecast short- to medium-term trends. With this tool, traders can better discern the strength or weakness behind market moves, making it a popular choice for traders interested in capturing shifts in momentum.
How to Calculate the On-Balance Volume Indicator
Calculating the OBV is straightforward. The On-Balance Volume formula can be described as such:
1.If the closing price > previous closing price:
- OBV = Previous OBV + Current Volume
2.If the closing price < previous closing price:
- OBV = Previous OBV − Current Volume
3.If the closing price = the previous closing price
- OBV = Previous OBV
In essence, if the closing price of the asset rises, the volume for that period is added to the previous OBV. Conversely, if the close price falls, the period’s volume is subtracted from the previous value. If the closing price remains the same, the OBV also stays unchanged.
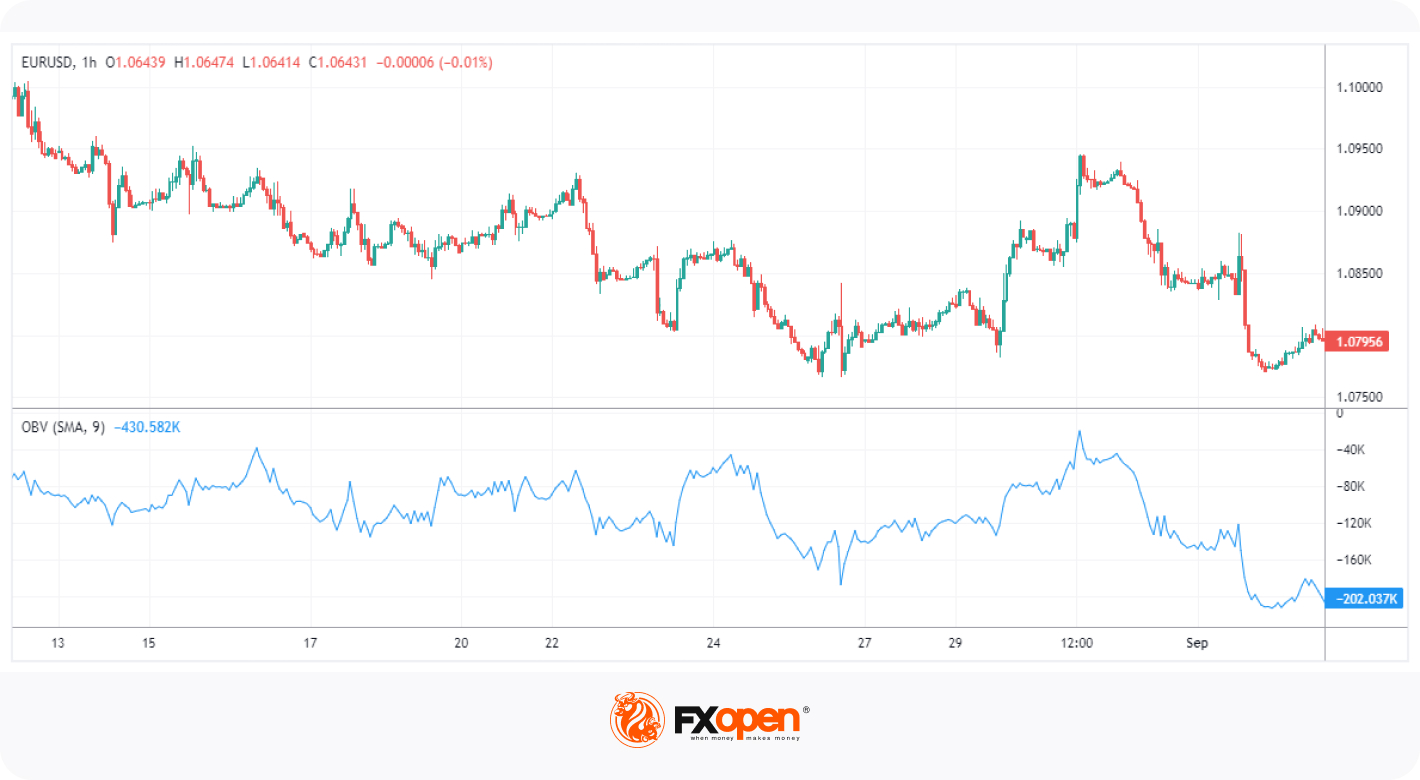
How to Use the On-Balance Volume Indicator
Understanding how to read the On-Balance Volume indicator can offer traders valuable insights into market sentiment. The signals produced typically fall under three categories: bullish signals, bearish signals, and divergences.
To follow along, consider using FXOpen’s free TickTrader platform. There, you’ll be able to apply this indicator to real-time data from hundreds of markets.
Bullish Signal
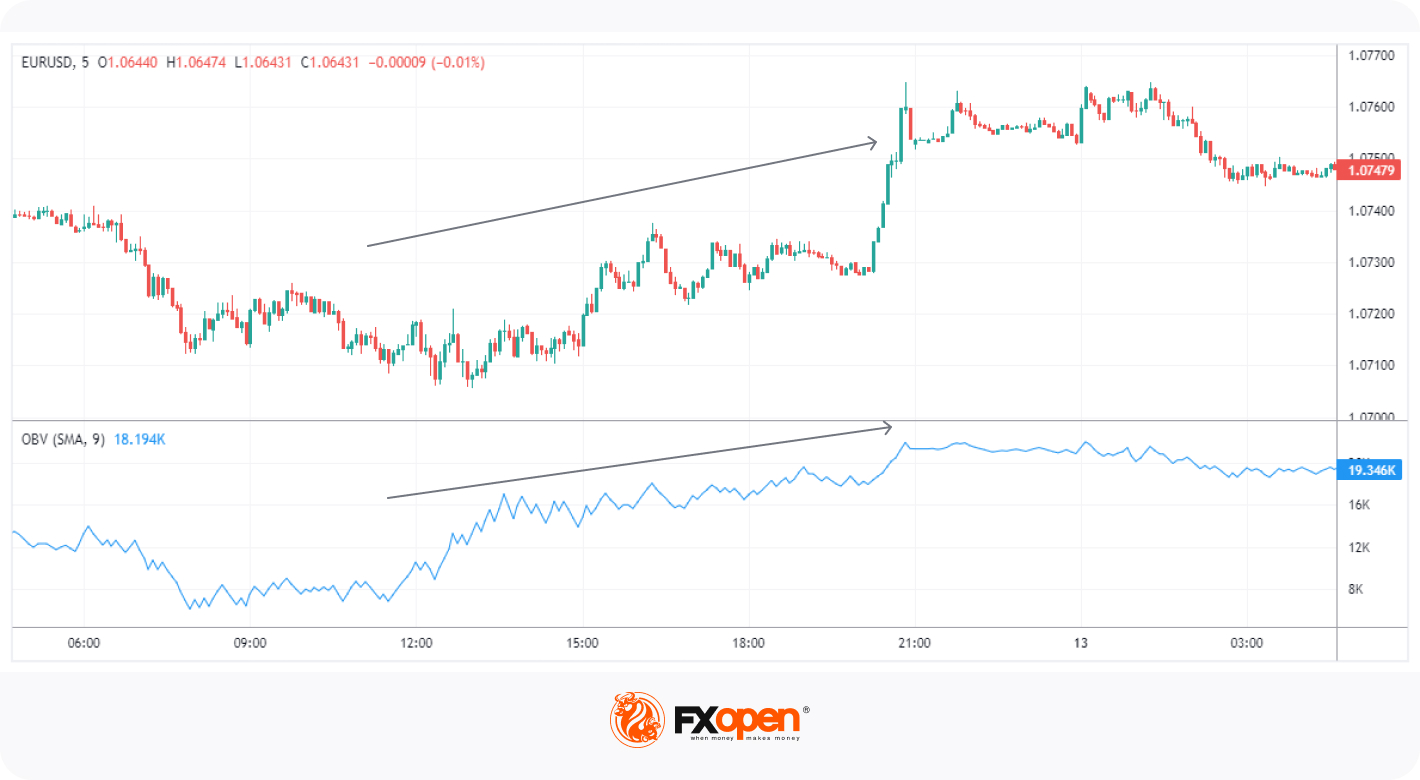
When the line rises in tandem with the asset's price, it indicates a bullish sentiment. In other words, the rising volume supports the upward movement, suggesting a strong likelihood that the uptrend will continue. Traders often consider this a favourable time to enter a long position.
Bearish Signal
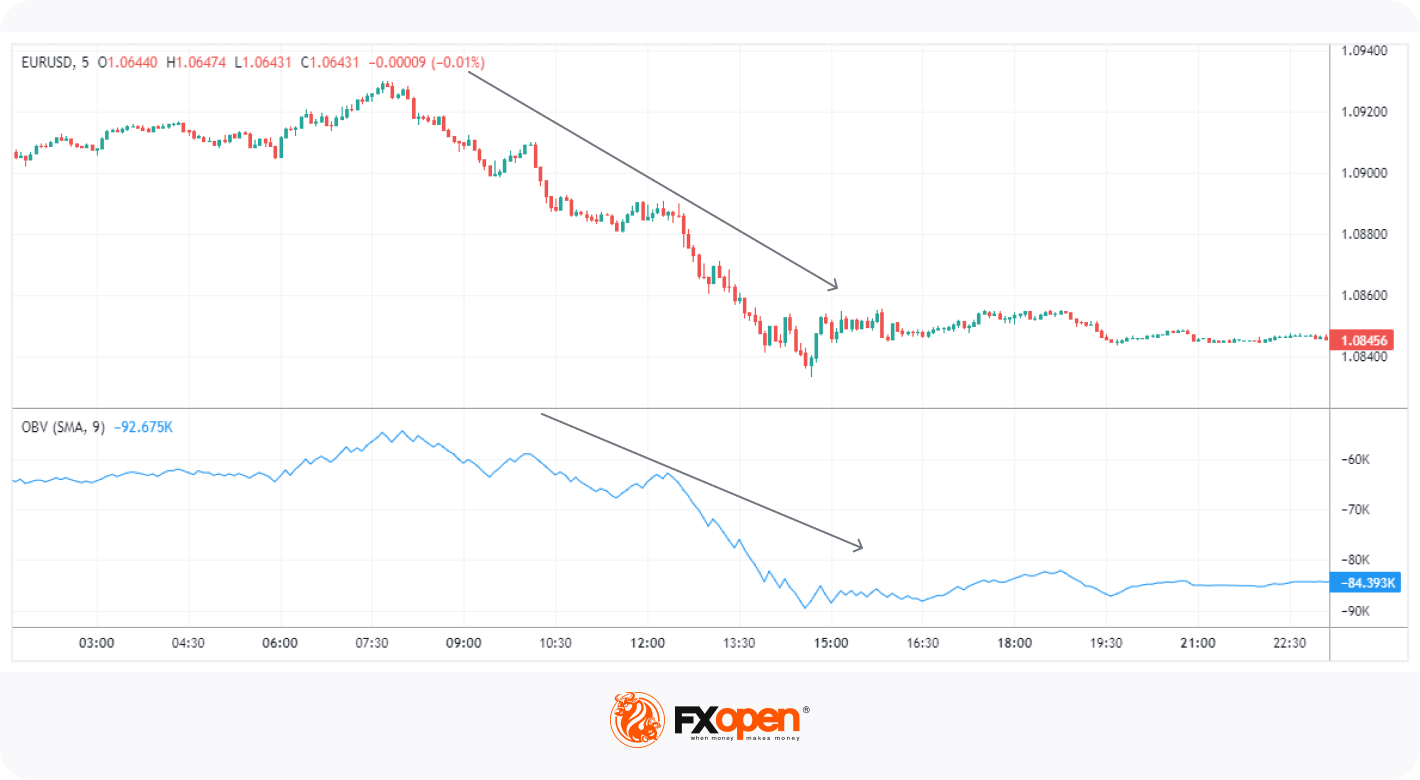
On the other hand, a falling line accompanied by a declining asset price signifies a bearish sentiment. The decreasing volume confirms the downward trend, signalling that the bearish momentum is likely to persist. This could be a sign for traders to exit long positions or consider entering a short position.
Divergence
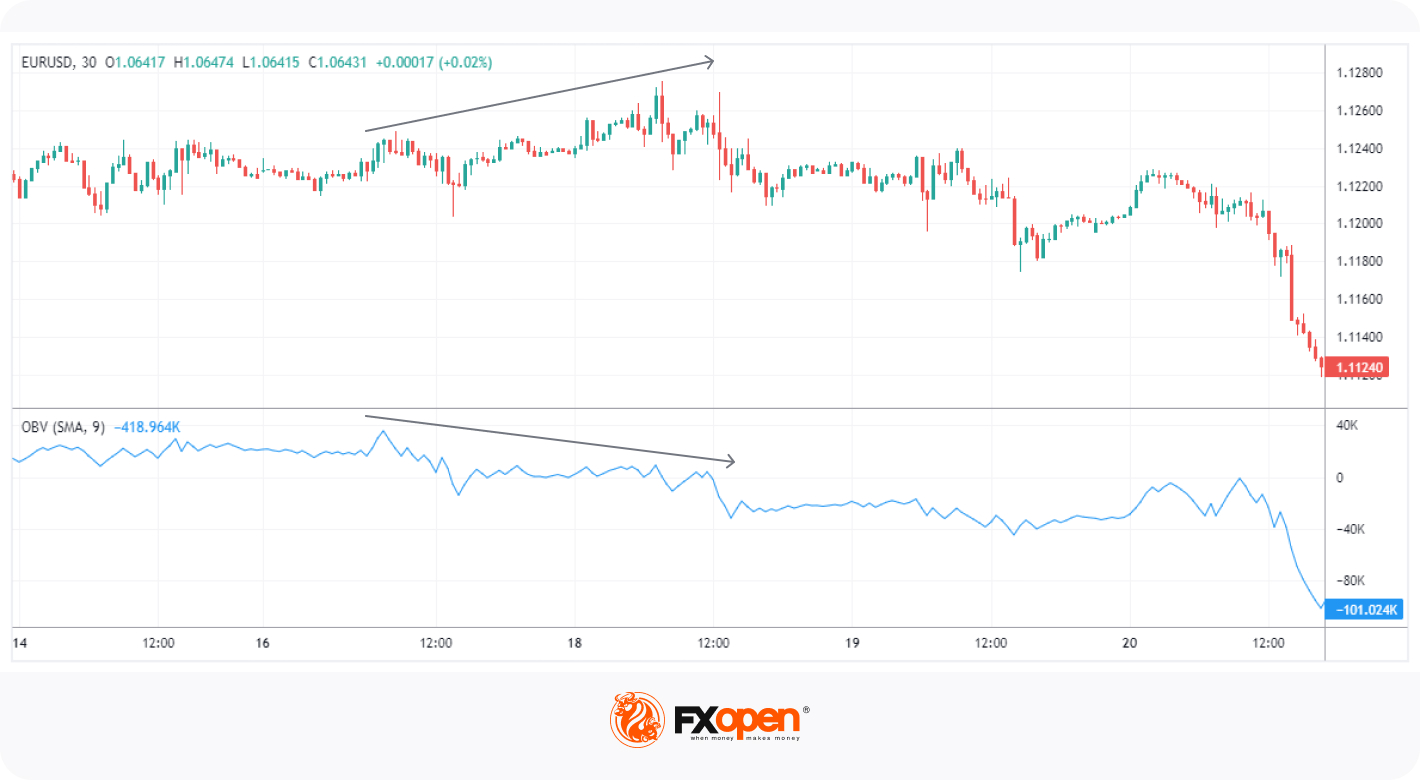
Divergence occurs when the OBV movement contradicts the asset’s price trend. For example, if the asset price is climbing, but the line is falling, this divergence could indicate that the upward trend is losing strength and may reverse soon. Similarly, if the asset is declining, but the OBV is rising, it suggests that the bearish trend could be nearing its end.
How to Combine the On-Balance Volume Indicator with Other Technical Analysis Tools
The OBV is powerful on its own, but its effectiveness is heightened when used in conjunction with other technical analysis tools. This approach allows traders to obtain a more nuanced understanding of market dynamics. Below are three commonly used technical tools that complement it.
Moving Averages
The concept of moving averages involves smoothing out price data to create a single flowing line, which makes it easier to identify the direction of the trend. When the OBV line moves in the same direction as the moving average or in the corresponding direction of a moving average crossover, it may be seen as confirmation of price direction. Here, it can act as a powerful trend-confirmation tool.
Relative Strength Index (RSI)
The Relative Strength Index gauges the velocity and variation of an asset's price swings, operating on a scale from zero to 100. Typically, an RSI reading exceeding 70 signifies the potential overbuying of an asset, whereas a value falling under 30 could point to potential overselling.
When OBV trend confirmations align with RSI levels, traders often find more robust signals for entry or exit points. For example, a bullish OBV signal combined with an RSI below 30 could provide a strong case for a potential upward reversal.
Support and Resistance Levels
Support and resistance levels are horizontal lines drawn on a chart, marking areas where an asset has historically had difficulty moving above (resistance) or below (support). When the OBV aligns with these levels, it might offer additional confirmation for entry or exit strategies.
For instance, if the line is rising and the price is nearing a resistance level, a breakthrough of that level could signal a strong upward trend. Conversely, a falling line, while the price nears a support level, might indicate a potential downward trend. Pairing the OBV with support and resistance levels thus provides an extra layer of validation for trend analysis.
The Bottom Line
In summary, understanding the OBV can provide additional insights into market dynamics and sentiment. When used alongside other technical tools, it becomes an even more powerful asset for market analysis. However, it’s worth noting that the OBV and these indicators may generate false signals, so it’s best to employ a holistic approach for optimal results.
Interested in applying these advanced trading techniques for real? Consider opening an FXOpen account to gain access to hundreds of markets, competitive trading costs, and lightning-fast execution speeds. Happy trading!
This article represents the opinion of the Companies operating under the FXOpen brand only. It is not to be construed as an offer, solicitation, or recommendation with respect to products and services provided by the Companies operating under the FXOpen brand, nor is it to be considered financial advice.
Stay ahead of the market!
Subscribe now to our mailing list and receive the latest market news and insights delivered directly to your inbox.


Latest articles

Intel at a Crossroads: Earnings Beat Meets Technical Resistance
Intel has just delivered its strongest quarter in over fifteen years, and the market reaction says it all. Q2 2026 revenue surged 25% year-over-year to $16.1 billion, crushing the consensus estimate of $14.42 billion, while adjusted EPS of

Tesla: Complex Range Structure Breaks Down Following Quarterly Earnings
Tesla released its Q2 2026 results after the market closed on 22 July. Revenue increased 26% year-on-year to $28.24 billion, while vehicle deliveries reached a record 480,126 units. However, operating margin fell sharply to 1.4%, down from

Pound Weakens After Soft UK Inflation Data as Euro Awaits Fresh Market Signals
The pound remains under pressure following the release of weaker-than-expected UK inflation data. The slowdown in inflation has strengthened expectations that the Bank of England could adopt a more accommodative policy stance in the coming months, weighing on sterling. Meanwhile,