


How to Trade with Williams Fractals
FXOpen

Trading reversals can often lead to successful trades, but identifying them is harder than it may seem. One tool that can offer valuable insights into reversals is the Bill Williams Fractal indicator. In this article, we’ll explore how this indicator works, its uses, and three effective fractal trading strategies.
What Is a Fractal?
In the world of technical analysis, fractals are repeating patterns that allow traders to identify possible reversal points in the market. They are composed of at least five consecutive bars, with the highest high or the lowest low in the middle and two lower highs or two higher lows on either side. Fractals are natural and recurring patterns that appear in all markets and timeframes - hence their name.
Types of Fractal
Fractals are categorised into bullish and bearish types. Bullish fractals form with a low surrounded by two higher lows, hinting at upward movement. Conversely, bearish fractals occur when lower highs surround a high, indicating possible downward momentum.
Fractals by Bill Williams: Definition
The Bill Williams Fractal indicator is a technical analysis tool created by the well-known trader and author Dr Bill Williams. Bill Williams wrote about the idea of fractals in his book, ‘Trading Chaos,’ where he also laid out their fundamental principle: that price action is repetitive across all timeframes.
His indicator, the Williams Fractal, automatically plots these fractals. Bill Williams fractals are bullish or bearish and represented by a down arrow or up arrow, respectively. It helps traders confirm that the price is reversing, but it also has several other uses, as you’ll see shortly.
Calculation of Bill Williams Fractal Indicator
The Bill Williams Fractal isn’t calculated like other indicators. Whereas most follow a specific calculation, the Bill Williams Fractals formula is more like an If statement. An If statement can be thought of like a flow chart: if X happens, do Y.
As such, we can describe the calculations of a bullish Williams Fractal as:
High[n] > High[n-2] and
High[n] > High[n-1] and
High[n] > High[n+1] and
High[n] > High[n+2]
And a bearish Williams Fractal as:
Low[n] < Low[n-2] and
Low[n] < Low[n-1] and
Low[n] < Low[n+1] and
Low[n] < Low[n+2]
Where:
n = the current high or low.
n - 2 = the high or low of the candle two periods ago.
n - 1 = the high or low of the previous candle.
n + 1 = the high or low of the next candle.
n + 2 = the high or low of the candle two periods ahead.
In other words:
- Select a specific candle.
- Check if the candle’s high/low is greater/less than the high/low of the two bars preceding it.
- Check if the candle’s high/low is greater/less than the high/low of the two bars following it.
If these conditions are met, an arrow will be plotted above or below the middle candle. The calculation may sound confusing, but you can always use an automatically implemented indicator on the free TickTrader platform.
The Williams Fractal’s period defaults to 2. This represents two candles on either side. You can increase its accuracy by changing this period to 3, 4, or 5, but this will also result in less frequent signals.
How to Trade Bill Williams Fractals
As you might imagine, these fractals appear everywhere. Their frequency can make it difficult to find tradeable signals. However, there are four applications that can be used to enhance an existing strategy or form the foundation of a more comprehensive one. These are: identifying reversals, finding support and resistance levels, confirming breakouts, and setting stop losses.
Identifying Reversals
While an arrow won’t be plotted until the reversal has peaked and made two lower highs/higher lows, this can still be handy when looking for a reversal in a particular area, like a Fibonacci retracement level. This process can be improved by watching the following two candles (that is, the four candles after the middle candle) to confirm that the reversal is truly taking place.
Support and Resistance Levels
Traders can also use fractals to spot potential support or resistance levels. As mentioned, for a reversal to occur, it means some area of support or resistance has been reached. They can then anticipate that these levels may hold in the future or that a breakout is underway if broken.
Given their frequency, these levels do often get broken. However, looking for fractals on a higher timeframe and then using the area marked as an area of support or resistance on a lower timeframe can be effective.
Confirming Breakouts
A breakout is defined as a known support or resistance level being traded through. As such, observing price closing beyond a fractal’s high or low can be considered a mini breakout, allowing traders to get involved on a lower timeframe.
Setting Stop Losses
Lastly, the highs and lows of fractals can also help us to place stop losses. For example, in an upside trend, we would expect the last area of support to hold if revisited, meaning just beneath its low may be a good place to set a stop loss.
Trading Strategies Using Bill Williams Fractal Indicator
Now, let’s take a look at three Bill Williams trading systems. If you’d like to follow along, you can go to the FXOpen website.
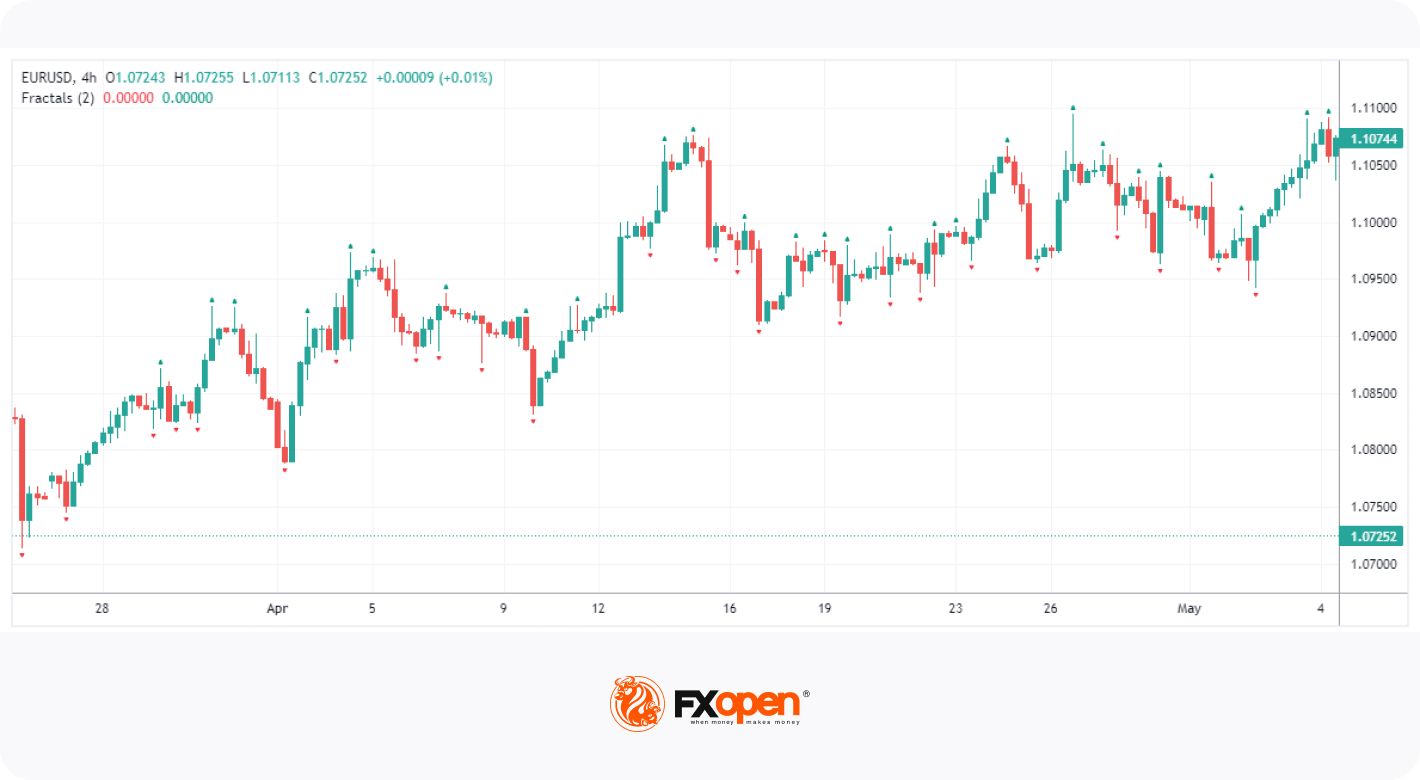
Fibonacci Retracements

Fibonacci retracements are a commonly used tool that can be used to pinpoint future reversal areas on a chart. In this strategy, we’ll look for a pullback to a key Fibonacci level (38.2%, 50%, and 61.8%), then confirm the reversal with a fractal.
First, traders look for a break of a significant support or resistance level, then wait for a pullback to one of the Fibonacci levels described. When the level is reached, they’d then wait for a fractal to appear in the direction of the predicted reversal and enter on the open of the next candlestick. Stop losses can be placed above/below the fractal, while profits may be taken at the top or bottom of the pullback.
Moving Averages
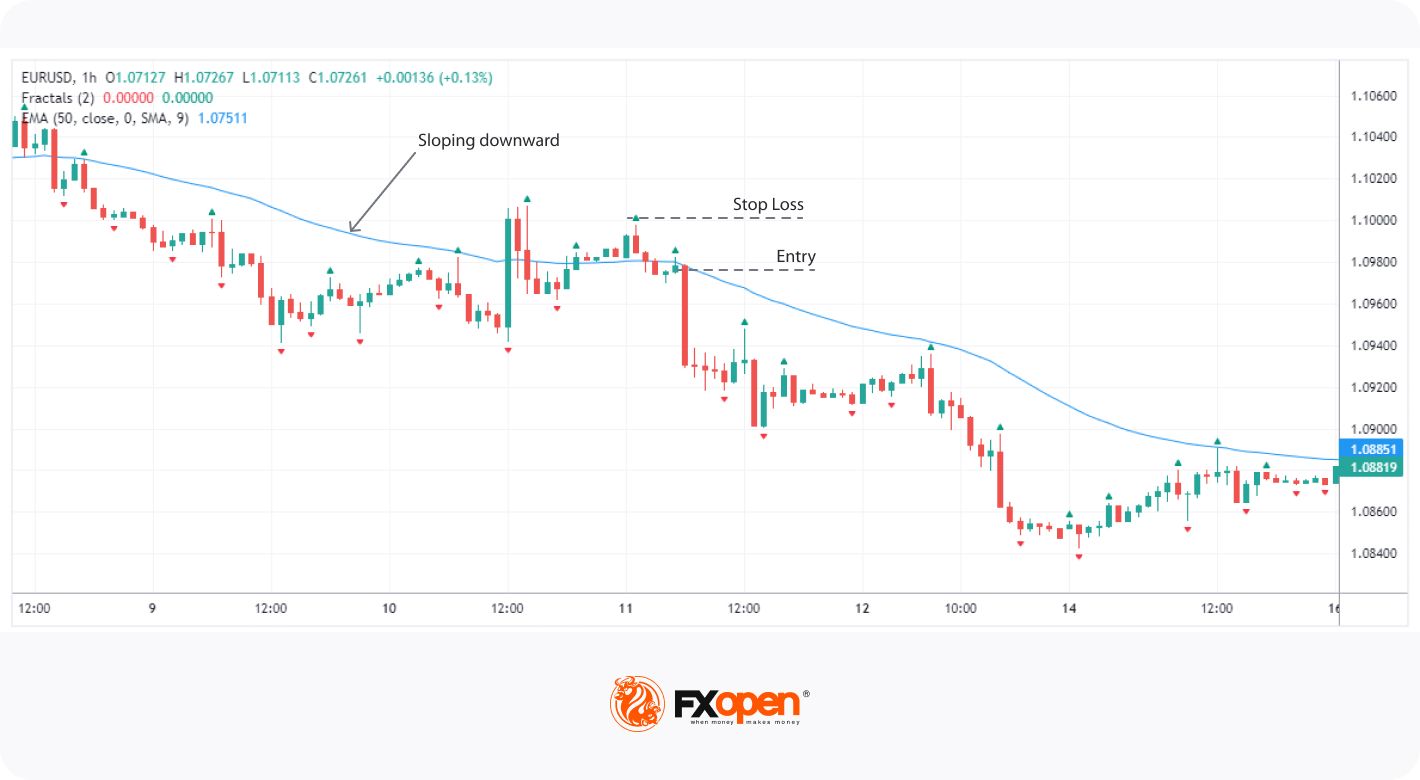
Moving averages, like the exponential moving average (EMA), can help traders identify a trend’s direction at-a-glance. Traders can set a directional bias using them – if it slopes downward, the trend can be considered bearish, and vice versa.
For this strategy, we’ll use a 50-period EMA, then look for the price to move below it when the EMA slopes upward or a move above when it slopes downward. This implies that the price is moving counter to its broader trend and has a decent chance of reversing to continue the trend. When this happens and a fractal is plotted, we have confirmation that a reversal is likely underway.
As before, we can enter on the open of the next candlestick after the fractal forms. Stop losses can be set above/below the fractal, and profits can be taken at a nearby support/resistance level.
Clusters
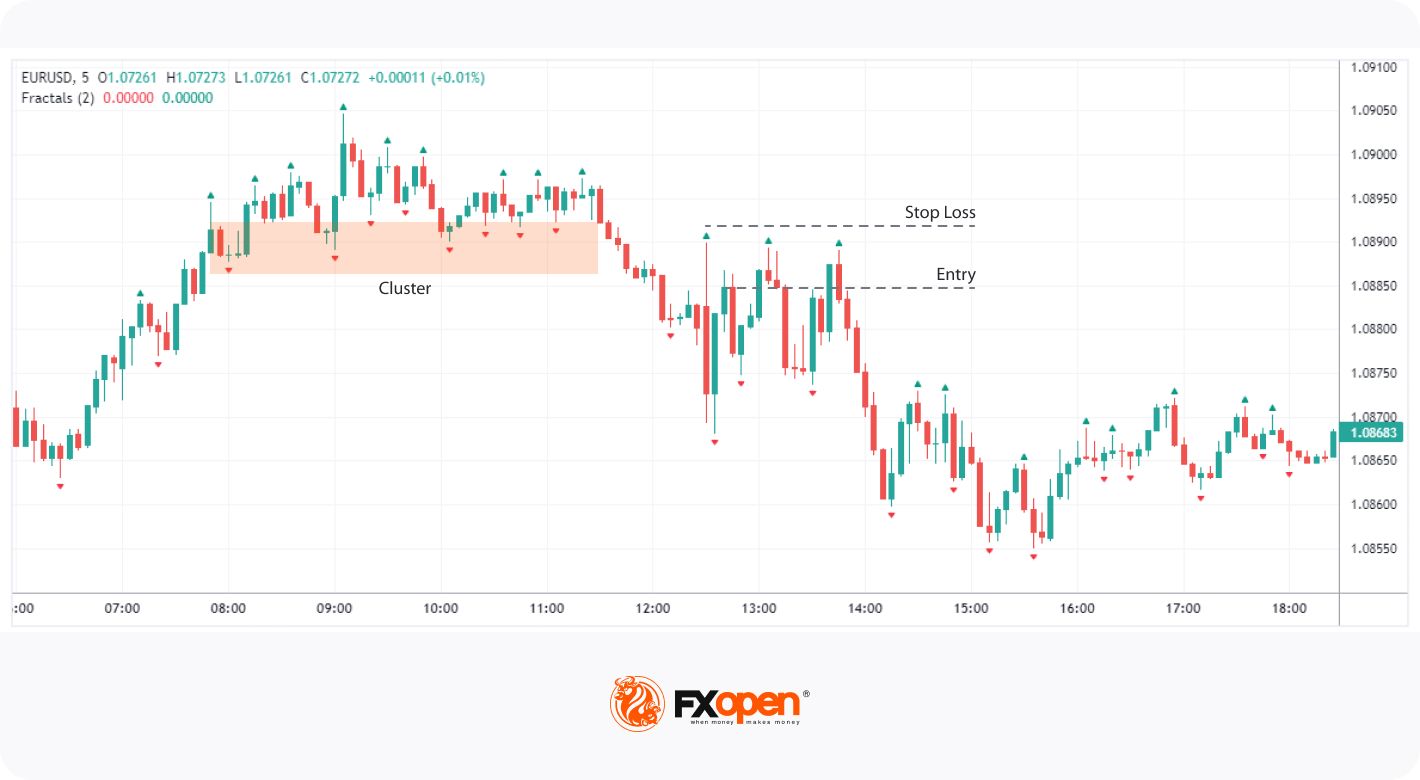
Finally, this strategy only requires the Williams Fractal trading indicator. Traders look for a ‘cluster’ of arrows to appear around roughly the same horizontal level (see chart above). This indicates a previously strong support or resistance level that’s weakening, which may lead to a surge in buying or selling once broken.
How many fractals form a cluster’s up to you, but 3 or 4 is a solid place to start. When the highest or lowest point in the cluster is broken with a candle that firmly closes below (i.e. a breakout), wait for a retracement and a fractal to form in the other direction. The retracement shouldn’t go beyond the opposing edge of the range.
We can then enter on the open of the candle after that fractal forms, with a stop loss above the entry fractal. Traders can consider closing the position at a nearby support or resistance level.
Advantages and Drawbacks of the Fractal Trading Indicator
To finish, let’s look at some of this indicator's key advantages and drawbacks.
Advantages
- Easy to Understand: The Fractal indicator’s simplicity and straightforwardness make it accessible to traders of all experience levels.
- Versatility: The indicator offers various uses that suit a wide range of trading styles.
- Frequent Opportunities: Fractals frequently occur in the market, providing traders with multiple trading opportunities.
Disadvantages
- Lagging Nature: As a lagging indicator, the Fractal indicator relies on past price movements and might not accurately predict future market changes.
- False Signals: The high frequency of signals produced by the indicator leads to many false signals that must be filtered.
- Less Effective in Ranging Markets: The Williams Fractal is often more useful in trending markets. In tightly-ranging markets, its signals may be less reliable.
Final Thoughts
In summary, fractals are a powerful tool in a trader’s arsenal, and the Williams Fractal indicator offers an easy-to-read representation of these patterns. While it may not shine in isolation, it can be an effective addition to any strategy. Ready to put your fractal knowledge to the test? You can open an FXOpen account to start using your strategy across 600+ markets in the advanced TickTrader platform. Happy trading!
This article represents the opinion of the Companies operating under the FXOpen brand only. It is not to be construed as an offer, solicitation, or recommendation with respect to products and services provided by the Companies operating under the FXOpen brand, nor is it to be considered financial advice.
Stay ahead of the market!
Subscribe now to our mailing list and receive the latest market news and insights delivered directly to your inbox.


Latest articles

NZD/USD Analysis: A Tug-of-War at the Critical Level
The kiwi has strengthened meaningfully against most peers this month. However, against the US dollar specifically, NZD/USD remains well below its 2026 highs, trading in the mid-0.58 area versus January's peak near 0.6075.
New Zealand's Q2 inflation

AUD/USD and USD/CAD React to Rising Geopolitical Risks
Commodity-linked currencies remain under pressure as geopolitical tensions in the Middle East continue to escalate. The United States has maintained strikes on targets in Iran, while the Tehran-backed Houthis have intensified threats to shipping in the Red Sea and near

GBP/CHF: Trendline or RSI — Which One Is Lying?
Sterling enters this week on firmer footing, with political uncertainty fading fast after Andy Burnham's confirmation as Labour leader eased investor concerns over the succession to Keir Starmer. Markets reacted further to reports pointing to Shabana Mahmood as the frontrunner