


How to Use the Best Klinger Oscillator
FXOpen
In the ever-evolving world of trading, finding the right tools and indicators to stay ahead of the game is crucial. One such tool that has withstood the test of time and continues to be popular among traders in 2023 is the Klinger oscillator. In this article, we will discuss what the Klinger oscillator is, how it works, and how to use it effectively.
What Is the Klinger Volume Oscillator?
The Klinger oscillator, also known as the Klinger volume oscillator, is a technical analysis tool used to measure the difference between two exponential moving averages (EMAs) of volume. It was created by Stephen Klinger in the 1980s to address the shortcomings of other tools that failed to capture changes in volume trends. The indicator can be used to identify bullish and bearish momentum, as well as potential trend reversals.
It’s plotted as two lines on a chart, one called the “Klinger” and the other known as the “signal”. The Klinger line oscillates according to volume force – a measure of price and volume – while the signal line is typically a 13-period moving average of the Klinger.
Klinger Volume Oscillator Formula
The Klinger oscillator is calculated by working out an asset’s volume force, and then subtracting a short EMA of volume force from a long EMA. Finally, the signal line is created by determining an EMA of the Klinger. The formula for the indicator is as follows:
Step 1: Compute the Volume Force (VF)
The first step is determining the Volume Force (VF). To do this, you'll need to calculate the following components:
1.1 Trend:
Calculate the difference between the current period's high and low prices (H-L).
1.2 Price Range (PR):
Find the range of prices by calculating the maximum of these three values:
- The absolute value of the current high minus the previous close (H-Cn-1)
- The absolute value of the current low minus the previous close (L-Cn-1)
- The current high minus the current low (H-L)
1.3 Volume Multiplier (VM):
Determine the Volume Multiplier by using this formula:
VM = [(Trend/PR) x 2] - 1
1.4 Calculate the Volume Force (VF):
Finally, compute the Volume Force using the following formula:
VF = VM x Volume
Step 2: Calculate EMAs of VF
Once you have the VF, you need to compute two EMAs of the Volume Force:
- A short-term EMA, typically 34 periods
- A long-term EMA, usually 55 periods
Step 3: Determine the Klinger Oscillator
Subtract the long-term EMA of VF from the short-term EMA of VF to obtain the indicator value:
Klinger oscillator = short-term EMA of VF - long-term EMA of VF
Step 4: Calculate the Signal Line
To create the signal line, compute the 13-period moving average of the oscillator.
The result is two lines: the faster Klinger oscillator and the slower signal. While this formula may seem complicated, the advent of trading software means you don’t need to try and calculate the Klinger oscillator in Excel. In FXOpen’s native TickTrader platform, you’ll find the Klinger indicator and dozens of other tools waiting for you.
How to Trade the Klinger Oscillator
The Klinger is a versatile tool that can be used in a variety of trading strategies. Here are two common ways to use the indicator while trading:
Trading Divergences

One way to use it is to look for divergences between the indicator and the price. A bullish divergence occurs when the price makes a new low, but the Klinger makes a higher low. This indicates that there is strong buying pressure despite the price being lower.
Conversely, a bearish divergence occurs when the price makes a new high, but the indicator makes a lower high. This indicates substantial selling pressure even with a higher price. Traders could use these divergences to enter trades in the corresponding direction.
You can learn more about regular and hidden bullish and bearish divergence here.
Trading Crossovers
The signal line is usually a 13-period moving average of the Klinger and serves to smooth out the Klinger and provide buy and sell opportunities. When the oscillator crosses above the signal line, it is a bullish sign, indicating that the momentum is shifting from bearish to bullish. Traders can use this sign to enter a long position.
Similarly, when the Klinger crosses below the signal, it demonstrates that the momentum is moving from bullish to bearish. This provides an opportunity for traders to go short.
How to Confirm Signals
It's important to note that traders do not rely solely on the Klinger indicator. It's always a good idea to confirm the signals with other technical and fundamental analysis tools.

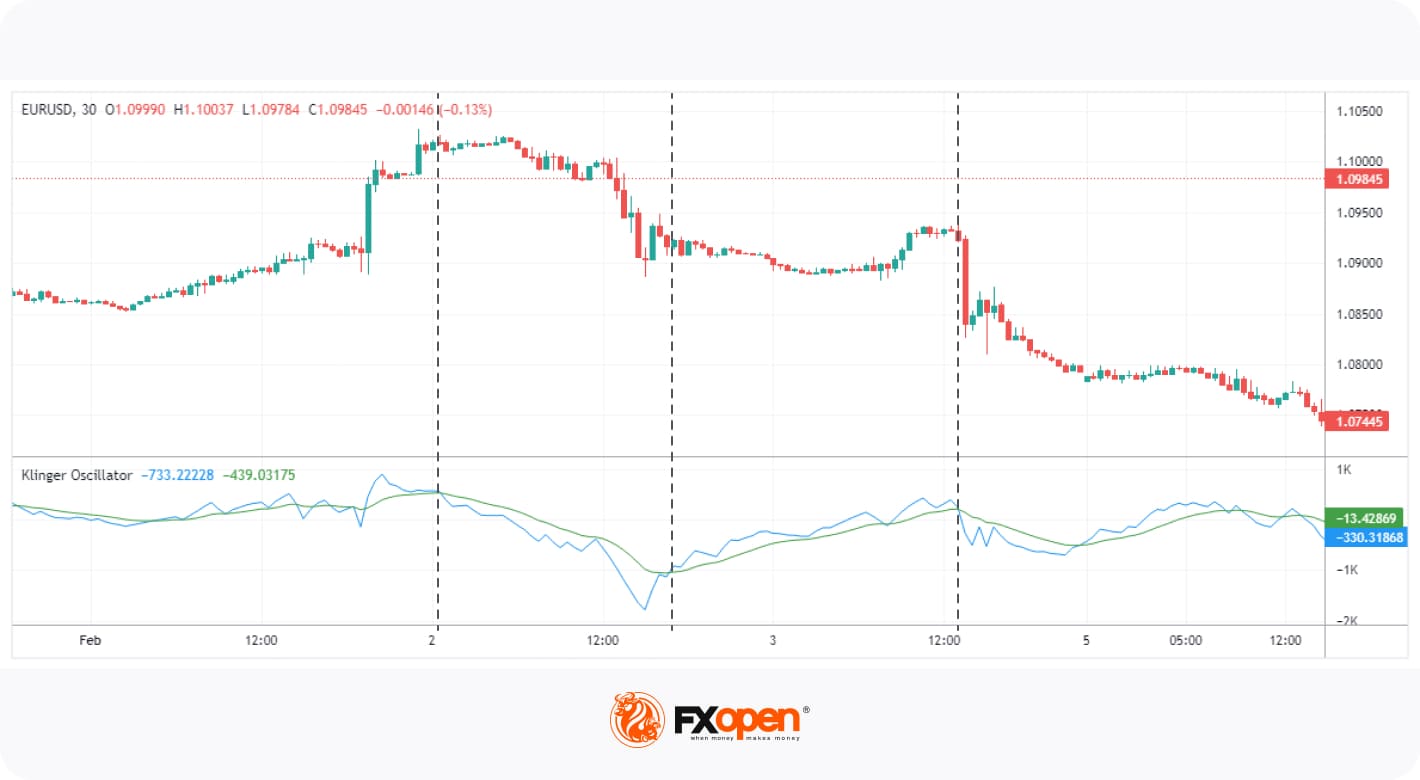
For example, if the oscillator crosses above the signal line and the price of the security is also above its 200-day moving average (blue), this could be a sign to buy. On the other hand, a potential sell signal emerges if it falls below the slower line and the security's price is also below its 200-day moving average.
One feature of the indicator not yet mentioned is the Klinger oscillator 0 line. The 0 level, while less important than divergences or crossovers, may be used to confirm the direction of the trend. While a move above or below 0 doesn’t necessarily precede a bullish or bearish trend, respectively, a bullish or bearish trend can be confirmed when the Klinger closes beyond 0.
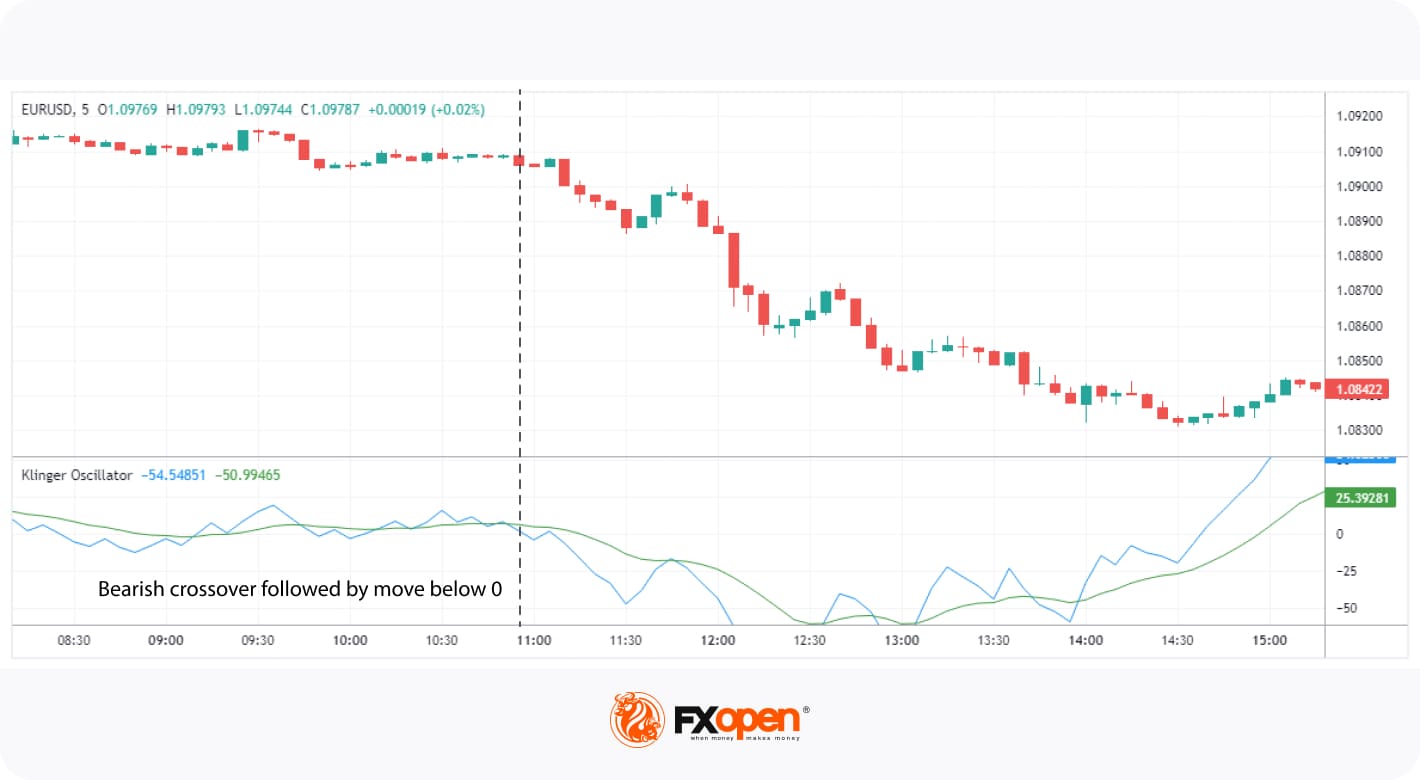
For instance, you could look for a bearish crossover (Klinger crosses below 0), then confirm the entry when the Klinger falls below 0, and vice versa. Doing so could help to reduce the number of false signals it generates.
Limitations of the Klinger Oscillator
While the Klinger is a handy tool for spotting trends and incoming trend reversals, it has its limitations. Here are some drawbacks of the indicator:
- It does give false signals, especially during periods of low or erratic volume.
- In trending markets, it may be unreliable and generate numerous false signals.
- The indicator can be affected by sudden spikes or drops in volume, which might distort the oscillator and the signal line.
Final Thoughts
In conclusion, the Klinger oscillator is an effective technical analysis tool that helps traders identify trends, momentum, and potential reversals in the market. By analysing volume and price data, it provides valuable insights into market dynamics and offers multiple signals, like divergences and crossovers.
Now that you have an overview of how to read the Klinger oscillator and how to trade its different setups, it’s time to put your knowledge into practice. You can open an FXOpen account to gain access to over 600 markets alongside low trading fees and lightning-fast execution speeds in the advanced TickTrader platform. Good luck!
This article represents the opinion of the Companies operating under the FXOpen brand only. It is not to be construed as an offer, solicitation, or recommendation with respect to products and services provided by the Companies operating under the FXOpen brand, nor is it to be considered financial advice.
Stay ahead of the market!
Subscribe now to our mailing list and receive the latest market news and insights delivered directly to your inbox.

Latest articles

EUR/USD Analysis: Who Is in Control?
Two central banks, two hawkish tones — but only one dollar just took a hit. The ECB delivered a 25bp hike in June, its first since 2023, lifting the deposit rate to 2.25% as Middle East-driven energy costs pushed headline

Gold Resumes Its Advance Following the US Labour Market Report
Gold is attempting to break its medium-term trend, with the latest US labour market data acting as the main catalyst. The US employment report released on 2 July came in noticeably weaker than expected, with the pace of hiring slowing

NZD/CHF Analysis: Which Currency Breaks the Consolidation First?
NZD/CHF remains locked in a tight range as traders await the next monetary policy catalyst.
The Reserve Bank of New Zealand heads into Wednesday's meeting on shaky ground. After May's 3-3 split was resolved by a casting vote, the