


How to Use the Golden Cross in Forex
FXOpen

The world of forex trading is filled with tools and indicators designed to help traders make informed decisions. Among these, the golden cross stands out as a widely recognised and used trading signal. In this FXOpen article, we will explain the concept behind the golden cross, compare it to the death cross, and show you its effective use in your forex trading strategies.
What Is a Golden Cross
The golden cross isn’t a technical indicator; it’s a signal provided by two moving averages (MAs) with different periods and confirming a newly formed uptrend. As the moving average is a trend-following indicator, the primary role of this signal is to identify potential trend reversals in the market.
The golden cross is based on the crossover of:
- Short-term moving average: This typically involves a 50-day simple moving average, which reflects short-term price trends.
- Long-term moving average: Usually represented by a 200-day simple moving average, this provides insights into long-term price movements.
Note: nowadays, some analysts believe that a golden cross may occur with SMAs of any period. Others stick to the rule that a golden cross stands only for a crossover of a 50-day MA above the 200-day MA.
Although you can add MAs with these periods on any timeframe and use the golden cross for day trading, it’s commonly used for medium- to long-term strategies, including swing trading and trend-following approach. Therefore, 50- and 200-period SMA are more effective on daily charts.
To recognise this signal on a price chart, traders look for market conditions at which the short-term moving average crosses above the long-term one at the early stages of the bullish trend. As the MA is a lagging indicator, you will likely find the cross once the trend has started to form.
What Is a Death Cross?
As we are talking about the golden cross, we need to mention the death cross. It’s an opposite signal that confirms a bearish trend is in place. The death cross occurs when a shorter-period (50-day) SMA breaks below the longer-term (200-day) SMA. A death cross can be used as an exit point in strategies based on the golden cross signal, and the same concept works in reverse.
Golden Cross Strategy
What is the best golden cross strategy? It’s quite easy to catch the golden cross signal. However, you need to remember that before applying it in live trading, it's essential to backtest your strategies. Historical analysis helps assess the indicator's effectiveness in specific currency pairs and timeframes, providing valuable insights into potential outcomes.
This strategy aims to enter trades when a golden cross occurs and exit when specific conditions are met.
Entry Rules:
Traders wait for the uptrend to start forming and consider a cross of the 50-day SMA above the 200-day SMA a confirmation to open a long position.
Take Profit Rules:
1. Death Cross: If the 50-day SMA crosses below the 200-day SMA, it's a signal to exit the trade. However, the MAs’ lagging nature may negatively impact the effectiveness of the exit point based on the death cross, as a trader may miss a part of the potential profit.
2. Static Take Profit: Traders may set a take-profit level at the closest resistance level or scale in and close trades partially.
Stop Loss Rules:
While the golden cross can be a powerful tool, managing risk is paramount in forex trading. Implementing well-placed stop-loss orders is a vital part of risk management. Initially, traders may set a stop loss below the crossover or the nearest significant support level.
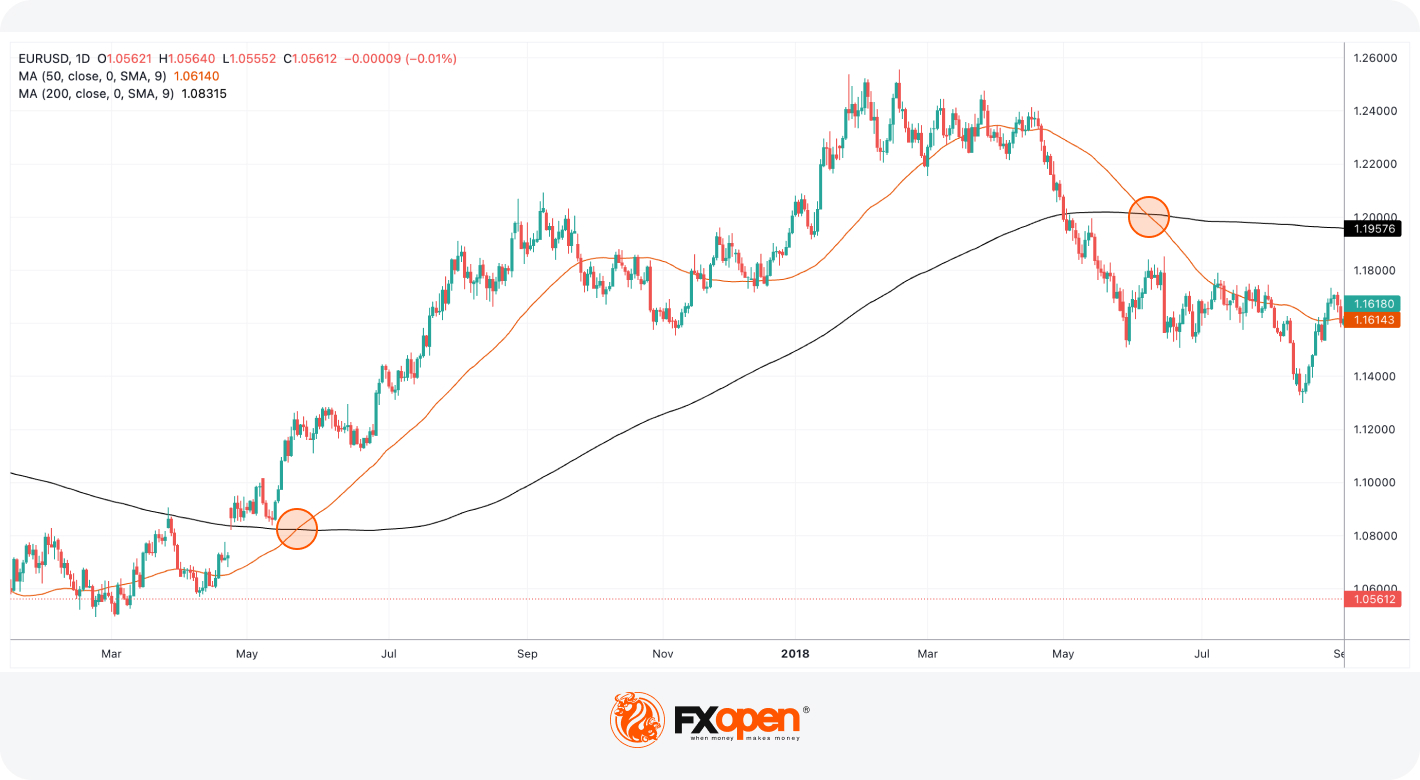
To illustrate the practical application of this golden cross forex strategy, we will provide a real-life example on a EUR/USD chart.
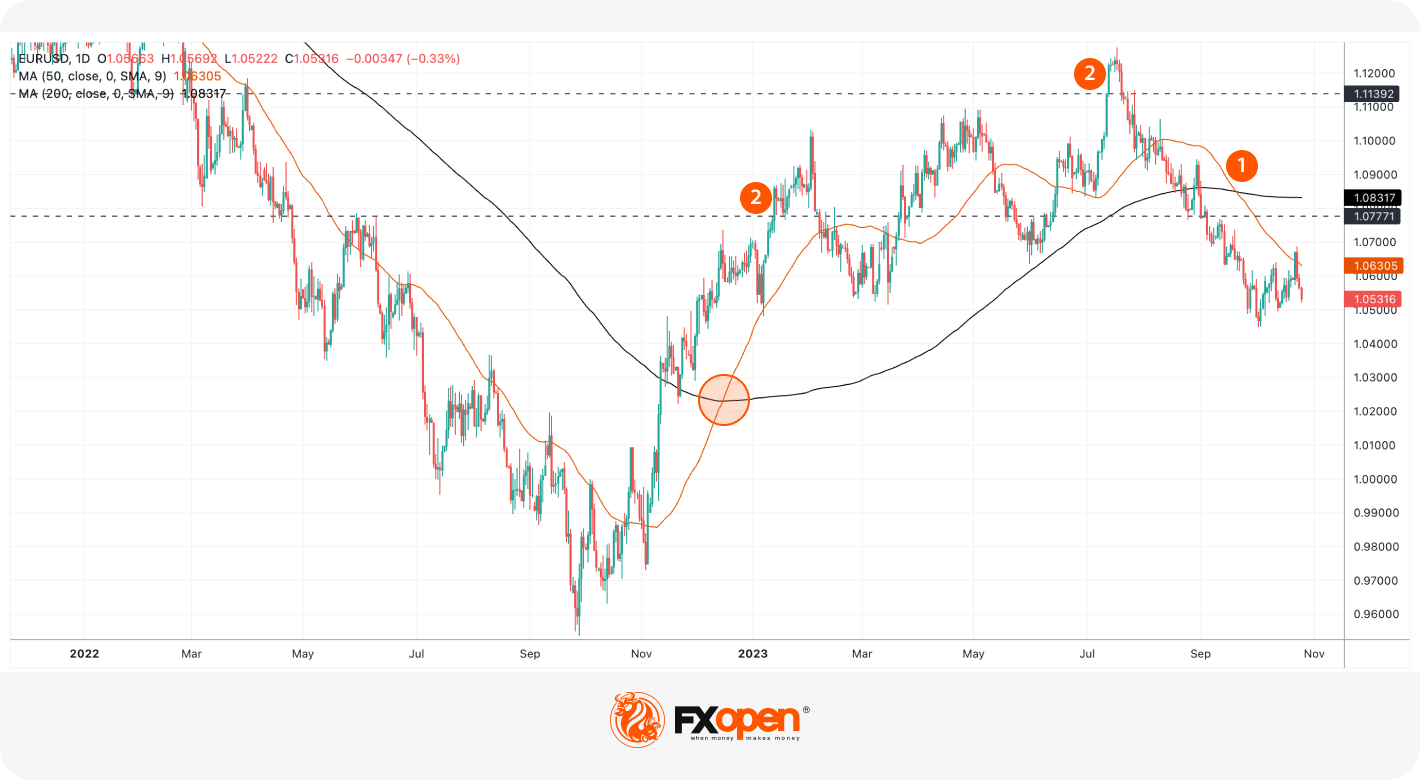
Note that this strategy won’t differ if you apply it to golden cross stock trading. It involves standard rules you can use in forex, stock, commodity, and crypto* markets. If you are ready to try this approach now, you can open an FXOpen account and apply this strategy to over 600 markets.
Common Pitfalls and Challenges
Utilising the golden cross in forex isn't without its challenges. Traders must be aware of the potential pitfalls. Addressing these issues with effective strategies and risk management techniques is essential.
- False Signals: One of the primary challenges is the possibility of false signals. Crossovers can occur in choppy or sideways markets, leading to whipsaws.
- Lagging Indicator: Moving averages are lagging indicators, meaning they reflect past price data. By the time a golden cross occurs, a significant portion of the price move may have already happened. Traders need to be cautious about chasing trends that may be losing momentum.
- Volatile Markets: In highly volatile markets, crossovers can occur frequently, making it challenging to determine which signals are reliable. Extreme price swings can result in numerous signals within a short period.
- False Confidence: Although MAs are a reliable trading tool, relying solely on them without considering other factors can lead to overconfidence in a trade. Traders usually conduct comprehensive analyses, including fundamental analysis and confirmation from other technical indicators.
- Period Selection: If you use the MA crossover signal but decide to change the period, choosing the right periods for the short-term and long-term moving averages is crucial. Different periods can yield different results. Traders may need to adjust these parameters based on the asset being traded.
- Psychological Challenges: Emotions play a significant role in trading. Traders may become overly optimistic or anxious when a golden cross occurs, affecting their decision-making. It's important to maintain discipline and stick to a predefined trading plan.
Combining the Golden Cross with Other Indicators
Combining the golden cross with other technical indicators and tools can enhance its reliability and help traders make more informed decisions.
Relative Strength Index (RSI): RSI measures the strength and momentum of a price trend. When the RSI breaks above the 50 level, it may confirm the golden cross, as the RSI signals the strength of the upward price movement.
Moving Average Convergence Divergence (MACD): The MACD is a trend-following momentum indicator. When the MACD provides a sign of the bullish price movement (the MACD line breaks above the signal line or the histogram rises above 0), it may serve as a confirmation of the golden cross.
Average Directional Index (ADX): ADX measures the strength of a trend. When the ADX is rising, it indicates that the trend is gaining strength, adding confidence to the trade.
Candlestick Patterns: Bullish candlestick patterns, such as bullish engulfing or hammer patterns, can add confirmation to the bullish signal.
Takeaway
Golden cross trading can prove a highly effective approach. By understanding it, you can make more informed trading decisions. However, it's essential to remember that no signal is foolproof, and continuous learning and adaptation are key to success in the dynamic world of forex trading. You can register on the TickTrader platform and test various trading approaches.
*At FXOpen UK and FXOpen AU, Cryptocurrency CFDs are only available for trading by those clients categorised as Professional clients under FCA Rules and Professional clients under ASIC Rules, respectively. They are not available for trading by Retail clients.
This article represents the opinion of the Companies operating under the FXOpen brand only. It is not to be construed as an offer, solicitation, or recommendation with respect to products and services provided by the Companies operating under the FXOpen brand, nor is it to be considered financial advice.
Stay ahead of the market!
Subscribe now to our mailing list and receive the latest market news and insights delivered directly to your inbox.


Latest articles

Amazon: Record Earnings Are Priced In as the Trend Loses Momentum
Fundamental backdrop
In the first quarter of 2026, Amazon (AMZN on FXOpen) reported a 17% increase in net sales to $181.5 billion. AWS revenue grew by 28% — its fastest pace in 15 quarters — while operating margin reached a record

Brent: The Downtrend Begins to Crack
Fundamental backdrop
In April 2026, the closure of the Strait of Hormuz pushed Brent prices to their highest levels per barrel since 2022. However, diplomatic developments reversed the market’s direction: by the end of May, prices had fallen by

Euro and Sterling Weaken as the Dollar Strengthens Ahead of Key US Data
The US dollar continues to hold firm against its major counterparts, supported by strong US macroeconomic data and expectations surrounding the release of further labour market indicators. Additional support for the greenback comes from persistent inflationary risks and the Federal