


Moving Average: Definition, Formulas, and Examples
FXOpen
Technical trading, also known as technical analysis, is a method of evaluating financial markets and making trading decisions based on historical prices and volume data, as well as various technical indicators and patterns. Moving averages are one of the common indicators used in technical analysis by many experienced traders. This article will answer the question “What is an MA indicator?” and explain the meaning of moving averages in technical analysis.
What Are Moving Averages?
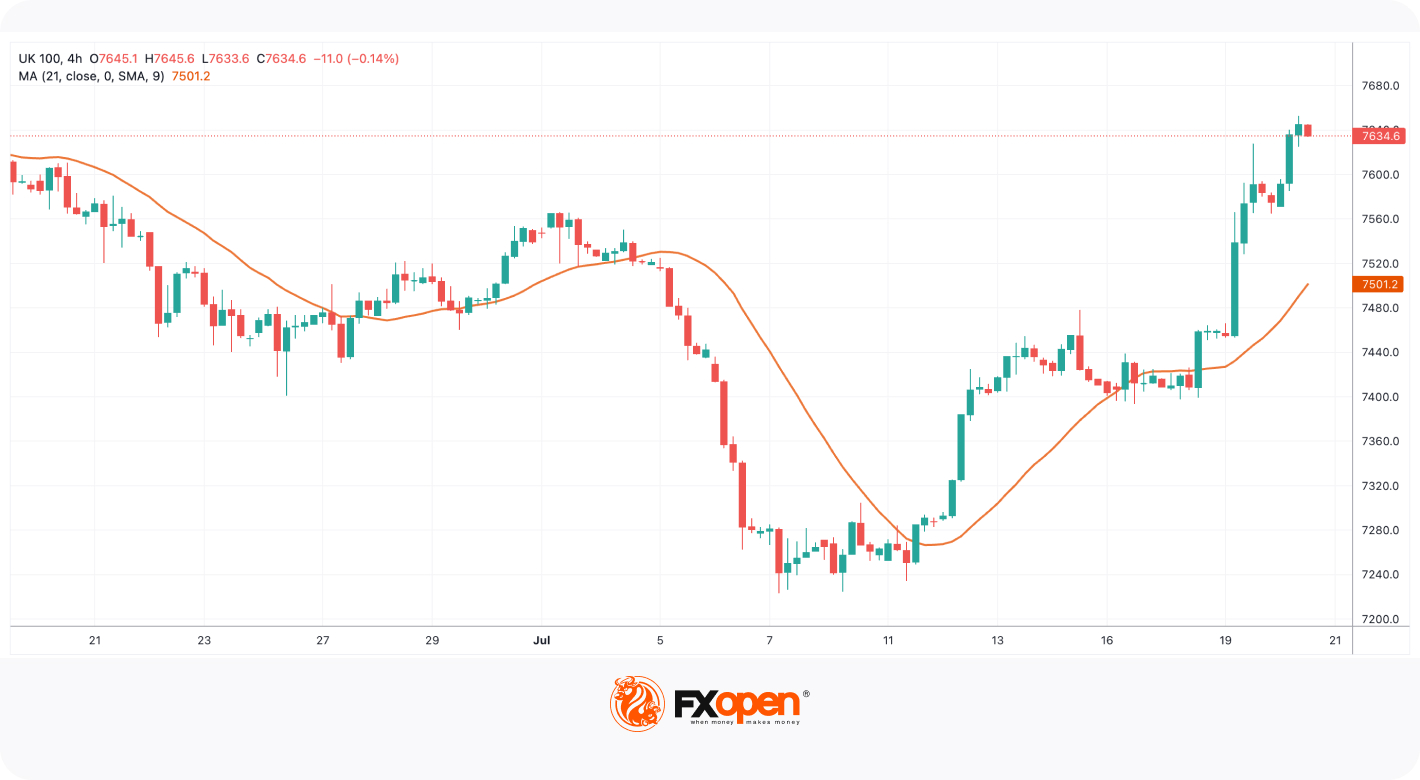
A moving average (MA) is a commonly used technical analysis tool that calculates an asset's average price over a specified period. It is called "moving" because it is continuously updated and recalculated as new data points become available. The indicator is considered lagging, meaning that it provides information about past events or trends that have been established.
By calculating the average price over a specific period, MAs may help traders and analysts identify trends and smooth out price fluctuations, making it easier to analyse price movements. We'll elaborate more on this later on in the article.
As a trader, you may be wondering how to calculate the moving average. There is no single moving average formula; each MA has its own unique features which determine the reliability and frequency of signals it provides.
Types of Moving Averages
There are several types of moving averages that traders and analysts use in technical trading. The most common averages are simple, exponential, and weighted. However, there are other types you can consider when building a trading strategy. The trader’s choice depends on their requirements and trading approach. Let's review some popular ones to understand moving averages better.
Simple Moving Average (SMA)
The simple moving average is one of the most basic and widely used technical indicators in finance and trading. It calculates the average price of an asset over a specified period by adding up the prices for a given period and then dividing the sum by the number of periods.
SMA smooths out price fluctuations and provides traders with an indication of the overall trend. The longer the time period considered, the smoother the SMA becomes. Still, the SMA lags more behind the current price action than other averages.
Exponential Moving Average (EMA)
The exponential moving average adds greater weight to recent data points, which makes it more receptive to price changes compared to the SMA. It assigns exponentially decreasing weights to past prices, with the most recent ones contributing the most to the average.
Traders prefer the EMA for its ability to quickly reflect current market conditions, allowing them to identify trends and potential reversals faster than with other moving averages. However, its responsiveness can also result in increased noise and false signals during choppy market periods.
Weighted Moving Average (WMA)
The WMA stands apart from the simple moving average and the exponential moving average due to its unique weighting approach. The WMA assigns varying weights to each data point determined by a weighting factor, which is determined by the analysed period. Unlike the EMA, which gives the most weight to the latest data point and then gradually decreases the weight for older data points, the WMA may give a higher weighting to any data depending on the formula. The most common case is to put more emphasis on the most recent prices, however, traders can also highlight historical prices.
Wilder Smoothed Moving Average
The Wilder moving average, also known as the Wilder’s smoothed moving average, is a variation of the exponential MA introduced by J. Welles Wilder Jr. in his book "New Concepts in Technical Trading Systems." This MA assigns exponentially decreasing weights to past prices but applies a smoothing factor that aims to reduce false signals and provide better trend-following capabilities. Wilder designed this MA with a focus on reducing market noise and enhancing trend detection, making it popular among traders who value smoother signals.
Double Exponential Moving Average (DEMA)
The double exponential moving average is a more complex indicator that aims to eliminate lag by using two EMAs. DEMA applies the EMA formula twice, first to calculate the EMA of the asset's price and then to calculate the EMA of the previously calculated EMA. This process results in a MA that is highly responsive to price changes, almost without lag. DEMA is suitable for traders who want rapid signals and to stay close to the price action.
Triple Exponential Moving Average (TEMA)
The triple exponential moving average takes the concept of DEMA one step further by applying the exponential MA formula thrice. It first calculates the EMA of the asset's price, then the EMA of the previously calculated EMA, and finally, the EMA of the previously calculated EMA. As a result, TEMA is even more responsive than DEMA and is particularly favoured by short-term traders looking for extremely fast moving averages.
Linearly Weighted Moving Average (LWMA)
The linear-weighted moving average assigns greater weight to more recent data points while linearly decreasing the weighting as we move back in time. This creates a MA that responds quickly to recent price changes while still considering historical data. LWMA is popular among traders who want an average that puts more emphasis on the latest market movements.
The main difference between weighted and linearly weighted moving averages lies in how the weights are assigned to the data points. WMA allows for the flexible assignment of weights based on a predetermined scheme, while LWMA assigns linearly increasing or decreasing weights to the data points.
Volume-Weighted Moving Average (VWMA)
The volume-weighted moving average considers price data and trading volume. The VWMA assigns greater weight to price data on days with higher trading volumes, which is believed to provide a more accurate representation of the market sentiment. Traders and investors often use the VWMA to gain insights into whether price movements are accompanied by strong trading activity, helping them identify significant trends and potential reversals.
Hull Moving Average (HMA)
The HMA utilises weighted moving averages to reduce lag and enhance accuracy. It combines two WMAs with different periods to create a smoother curve, adapting swiftly to market changes. HMA is renowned for its ability to filter out noise and provide precise signals during trending markets, making it popular among trend-following traders.
Guppy Multiple Moving Average (GMMA)
The GMMA employs two sets of exponential moving averages, six short-term and six long-term. The indicator is highly valuable due to its effectiveness in detecting changes in trend directions with enhanced clarity compared to standard moving average methods. By employing multiple MAs, the GMMA effectively eliminates market noise and provides a more precise depiction of the prevailing trend.
Arnaud Legoux Moving Average (ALMA)
The ALMA is an indicator designed to mitigate lag effectively. It offsets the moving average to the right or left, adapting to both volatility and price direction. By enhancing responsiveness during high volatility and reducing noise during low volatility, ALMA provides a smoother curve and more precise signals.
Smoothed Moving Average (SMA)
The smoothed moving average reduces noise and offers a steadier trend line. The process of its calculation involves taking a series of data points over a specified time period and calculating their average. The resulting average is then smoothed by applying a smoothing factor or a smoothing function. It is beneficial for traders looking for a stable indication of the overall trend.
Least Squares Moving Average (LSMA)
The LSMA uses the least squares method to reduce lag and offer better responsiveness. It provides a more accurate representation of price movements, particularly during trending markets, and can be used to predict price direction.
What Do Moving Averages Tell Us?
Moving averages in stocks, forex and other financial instruments are used in various ways depending on the trading strategy and objectives of the trader. Here are some common uses traders at FXOpen may employ:
- Trend identification: MAs help identify the direction of the overall trend. When the price is above the MA, the trend is generally considered bullish, and when it is below the MA, the trend is considered bearish.
- Support and resistance levels: MAs can act as dynamic support or resistance levels. Traders often look for price bounces or breakouts around the indicator.
- Crossovers: Crossovers are essential technical indicators that traders use to identify potential changes in trends and generate buy or sell signals. When an MA with a shorter period (e.g., 50) crosses above an MA with a longer period (e.g., 200), it is considered a bullish signal, indicating a potential uptrend. Conversely, when the short-term MA breaks below the longer-term MA, it is a bearish alert of a potential downtrend.
- Price and moving average relationships: Traders analyse the relationship between the price and the indicator to identify potential entry or exit points. For example, if the price stays above the MA during an uptrend, it may present a buying opportunity.
- Trailing stop: Traders sometimes use MAs as trailing stop-loss levels. They adjust their stop-loss orders based on the MA to protect profits.
Conclusion
Understanding the characteristics and applications of different MAs may assist in making informed trading decisions. Despite their usefulness, it's essential to acknowledge that moving averages, like any technical analysis tool, are not foolproof and can produce false signals, especially during choppy or ranging markets. Therefore, it's vital to complement MA analysis with other indicators and fundamental analysis for a more comprehensive understanding of the market conditions and potential trading opportunities.
You can practise on a free TickTrader platform. Once you feel comfortable using the indicator, you may open an FXOpen account to trade on different markets.
This article represents the opinion of the Companies operating under the FXOpen brand only. It is not to be construed as an offer, solicitation, or recommendation with respect to products and services provided by the Companies operating under the FXOpen brand, nor is it to be considered financial advice.
Stay ahead of the market!
Subscribe now to our mailing list and receive the latest market news and insights delivered directly to your inbox.


Latest articles

Intel at a Crossroads: Earnings Beat Meets Technical Resistance
Intel has just delivered its strongest quarter in over fifteen years, and the market reaction says it all. Q2 2026 revenue surged 25% year-over-year to $16.1 billion, crushing the consensus estimate of $14.42 billion, while adjusted EPS of

Tesla: Complex Range Structure Breaks Down Following Quarterly Earnings
Tesla released its Q2 2026 results after the market closed on 22 July. Revenue increased 26% year-on-year to $28.24 billion, while vehicle deliveries reached a record 480,126 units. However, operating margin fell sharply to 1.4%, down from

Pound Weakens After Soft UK Inflation Data as Euro Awaits Fresh Market Signals
The pound remains under pressure following the release of weaker-than-expected UK inflation data. The slowdown in inflation has strengthened expectations that the Bank of England could adopt a more accommodative policy stance in the coming months, weighing on sterling. Meanwhile,