


Mastering the Supertrend Indicator for Crypto Day Trading
FXOpen
Every trader knows the phrase “trade with the trend.” That’s where a simple yet effective indicator known as Supertrend comes in. This tool can help you identify and get in early on emerging trends. Therefore, it has found significant popularity amongst crypto day traders. In this article, we will take a closer look at the Supertrend indicator, discussing its signals, the most common settings, and four strategies you can get started with right away.

What Is a Supertrend Indicator?
A Supertrend indicator is a technical analysis tool designed to help traders identify and follow market trends. It’s a lagging indicator that can be used to develop comprehensive trend-following strategies, assisting traders in spotting reversals and the start of new trends.
The Supertrend indicator is calculated using two key components: average true range (ATR) and a multiplier. The ATR measures the overall price range of an asset, offering an indication of its volatility. The multiplier allows traders to change the sensitivity of the indicator.
The Supertrend indicator formula is as follows:
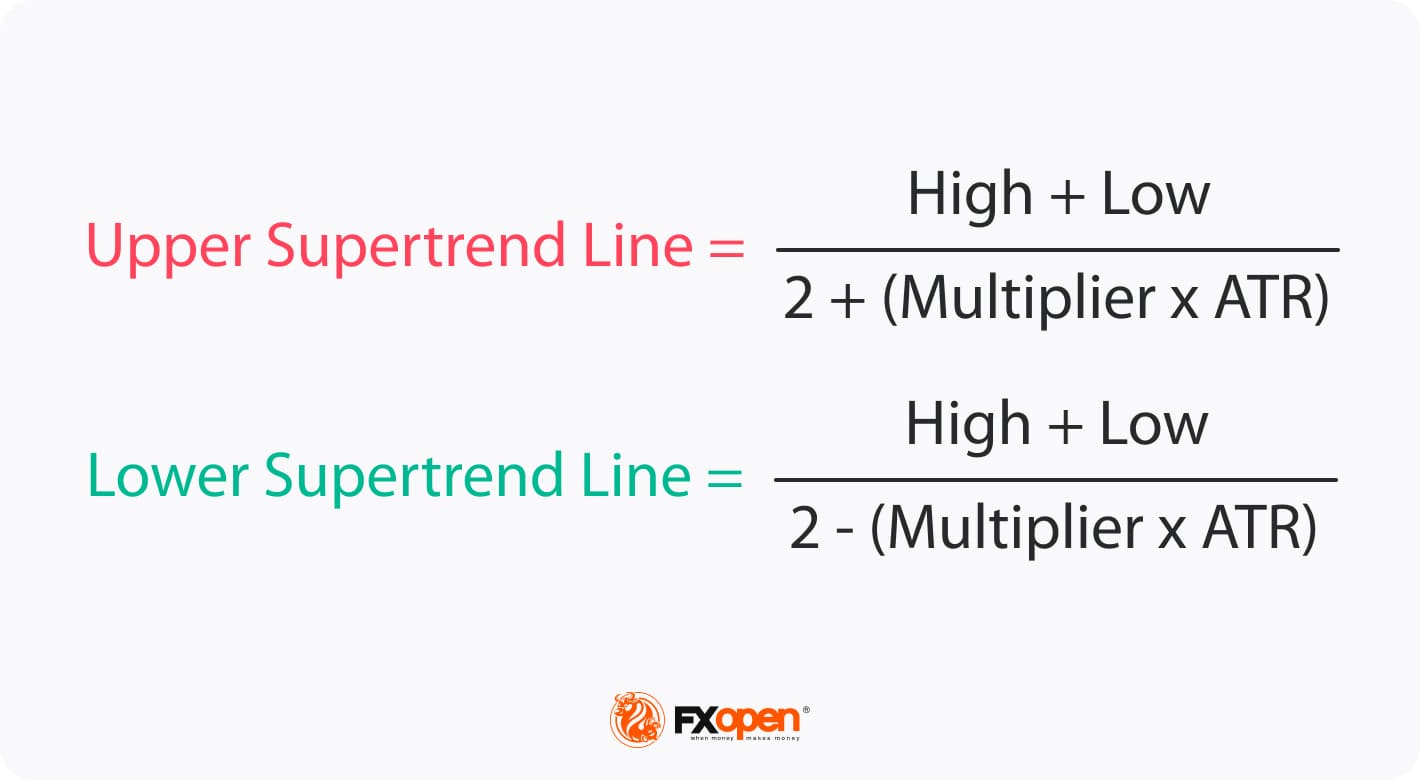
The default settings for ATR and the multiplier are typically 10 periods and 3, respectively. A shorter ATR will give more weight to recent price action, while a longer ATR will smooth out values. However, changing this value won’t have as much bearing on the indicator as the multiplier.
By moving the multiplier up or down, traders can adjust the Supertrend’s sensitivity. A lower multiplier increases the number of overall signals, including false signals, while allowing for a tighter stop loss. A higher multiplier will generate fewer signals, often at the cost of a wider stop.
Identifying Trade Signals
The Supertrend indicator offers fairly simple buy and sell signals, determined by observing the relationship between the price and the line.
Buy signals occur when the price crosses above the Supertrend line. In this scenario, the Supertrend line often acts as a dynamic support level, which could be an ideal entry point for a long position. The bullish trend is considered intact as long as the price stays above the Supertrend line.
Sell signals are generated when the price falls below the Supertrend line. Similarly, the Supertrend line acts as a dynamic resistance level, which may be a suitable entry point for a short position. Traders can maintain their short positions if the price remains below the Supertrend line.
How Traders Use the Supertrend Indicator for Crypto Trading
The indicator can be applied to various timeframes, from intraday charts to daily and weekly charts. However, shorter timeframes, such as the 5-minute or 15-minute, are more common for day trading, as they offer more frequent trading opportunities.
What Are Supertrend Indicator’s Best Possible Settings for Crypto Trading?
In truth, there is no one-size-fits-all setting. Generally speaking, the theory says it’s best to keep the ATR value somewhere between 10 and 20 since this will provide a good mix of sensitivity to recent price action and smoothing.
As for the multiplier, the standard factor of 3 is suitable. Some traders may prefer to adjust it to 4, 5, or 6, to account for cryptocurrency volatility, although this may lead to a worse risk/reward ratio. Ultimately, your choice will depend on market conditions and the crypto asset you’re trading, so it’s wise to experiment to find your optimal configuration.
Supertrend Indicator Settings for Intraday Crypto Trading
Determining the Supertrend indicator’s best possible settings for intraday trading typically involves adjusting it to increase sensitivity to price fluctuations. One possible configuration is to use a multiplier of 2 and an ATR period of 10. This setup can help identify more trade signals and adapt to rapid market changes, allowing traders to enter and exit within a few minutes or hours.
Supertrend: Best Possible Settings for Cryptocurrency Swing Trading
Given that swing trading typically involves holding positions for several days or weeks, swing traders may prefer to adjust the settings slightly higher. This will offer a clearer reading of the broader trend. The ATR can be set anywhere between 10 and 20, while a multiplier of 5 will reduce the number of false signals.
Trend-following swing traders may also take advantage of setting a bias using the Supertrend on the 4-hour or daily charts and then using the hourly chart to enter trades. It’s not uncommon for an asset to range on the hourly chart and whipsaw above and below the Supertrend while remaining bullish or bearish on the higher timeframes. This can help traders avoid confusion when the market ranges.
Supertrend Indicator: Confirmation Tools
The indicator’s signals can be simple and effective in trending markets but also incorrect in ranging markets, meaning traders seek extra confirmation before considering entries. Below are some popular confirmation methods:
- Relative Strength Index (RSI): When used with the Supertrend, RSI helps confirm trend strength. A reading above 50 indicates a bullish trend, while below 50 suggests bearishness.
- Moving Averages: Combining the Supertrend with moving averages (such as the 50- or 200-period) can confirm the overall market direction. Entries might be more accurate when the price is aligned with both indicators.
- Volume: Higher volume during a Supertrend signal strengthens its validity, as it shows significant market participation.
- Stochastic Oscillator: This indicator helps spot overbought and oversold conditions, complementing the Supertrend to confirm potential reversals.
- Price Action: Candlestick patterns and horizontal support/resistance levels can be used alongside Supertrend signals to gauge market sentiment and improve entry/exit decisions.
Four Supertrend Indicator Strategy for Cryptocurrency Trading
Now that we have an idea of what the Supertrend indicator is, how it works, and the settings to use, we can begin to formulate some strategies. If you want to test them, you can try our free TickTrader trading platform. There, you’ll find the Supertrend indicator and dozens of other technical tools waiting for you to use.
1-Minute Supertrend Scalping Strategy
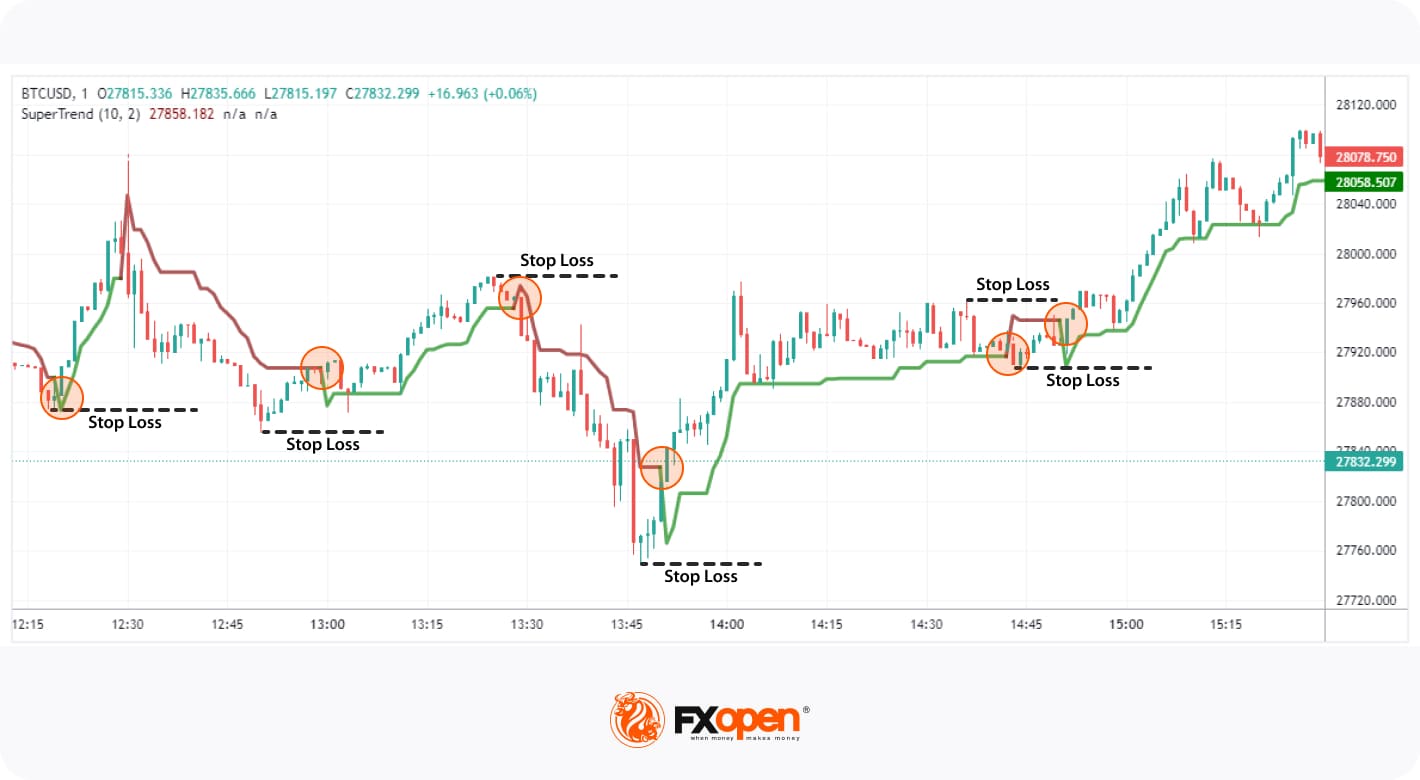
Using the 10-period ATR and 2-factor multiplier mentioned, we can create a 1-minute Supertrend crypto scalping strategy.
Entry: When the line turns green/red, traders enter with a long/short market order as the candle closes.
Stop Loss: Below or above the nearest swing low/high, depending on the direction of the trade.
Take Profit: Traders close the trade when the Supertrend switches to another colour.
As seen in the example, this provides traders with some decent scalping opportunities to enter early with relatively tight stop-loss levels.
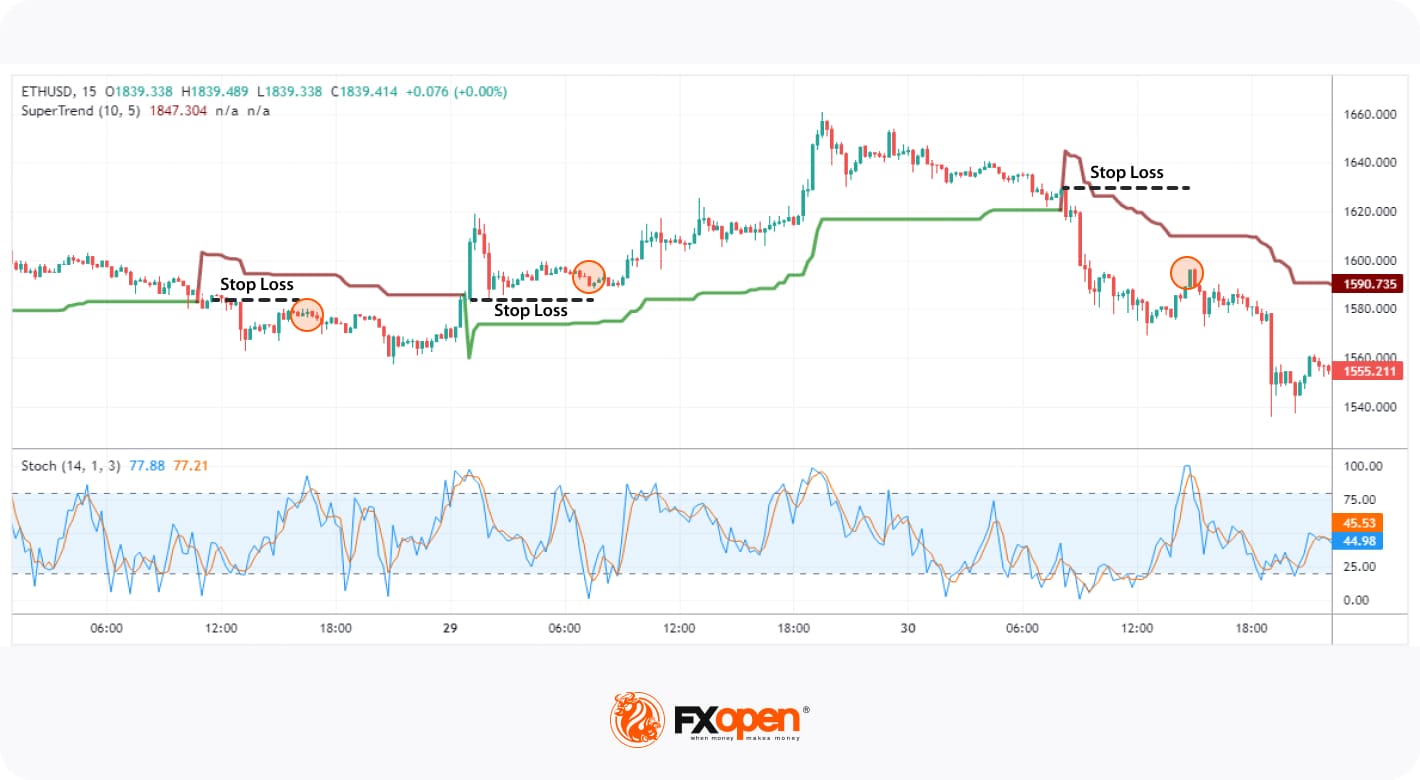
Double Supertrend Strategy
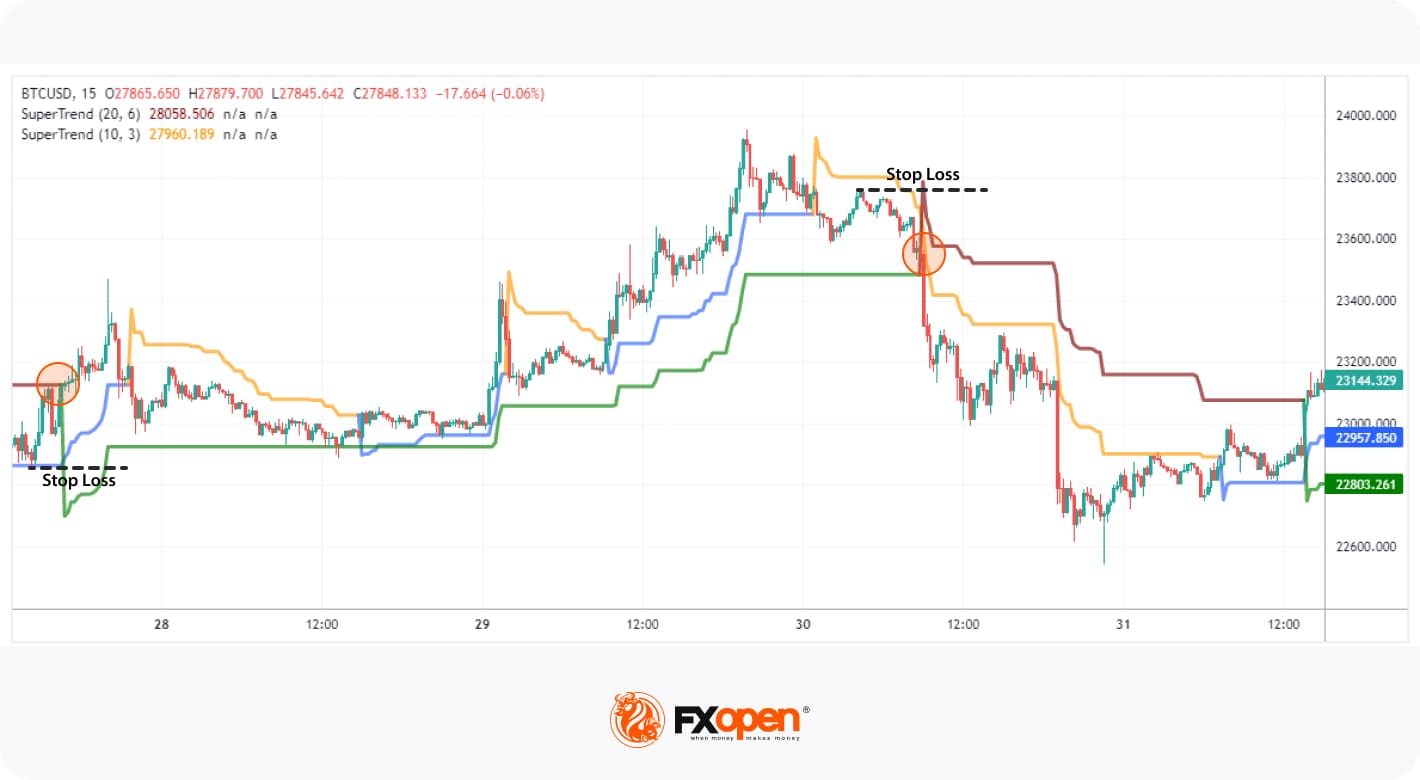
This strategy uses two Supertrends with different settings to reduce the number of false signals. It aligns the more sensitive Supertrend’s signals with a less reactive version while still allowing for relatively tight entries.
Requirements: A fast Supertrend with lower settings (blue and orange) – default 10-period ATR and 3-factor multiplier and a slow Supertrend with higher settings (green and red), like 20 and 6.
Entry: The fast Supertrend will typically precede the slow Supertrend, so observe the fast signals and wait for the slow lines to confirm the direction (both should show either bullish or bearish). Traders can enter with a market order once confirmed or wait for a retrace to the slow Supertrend and enter with a limit order.
Stop Loss: Above or below a nearby swing high/low depending on the trend direction.
Take Profit: Traders close the trade when the slow Supertrend signals a change in direction.
In the example shown, we can see that while the faster Supertrend switches back and forth between bullish and bearish, our strategy stays aligned with the stronger overall trend, allowing us to capture the bulk of the move until it reverses.
3 Supertrend Strategy
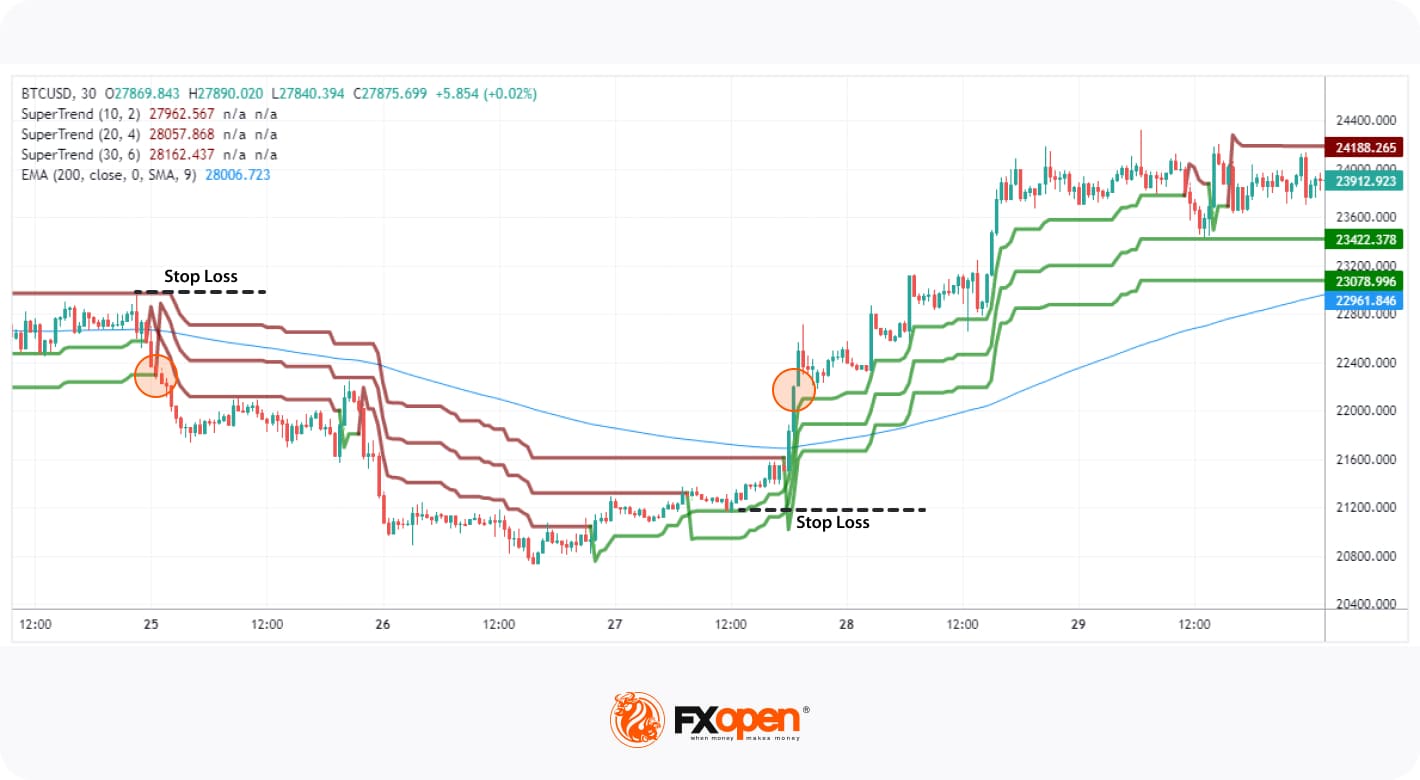
This strategy seeks extra confirmation using three Supertrends and an Exponential Moving Average (EMA). Simply put, we wait until all four align before considering an entry.
Requirements: Three Supertrends with varying settings. We’ve used 10 and 2, 20 and 4, and 30 and 6. You’ll also need a 200-period EMA.
Entry: Traders wait until all three Supertrends are green and the price is above the 200 EMA for a long entry, and vice versa, to enter with a market order.
Stop Loss: Below or above a nearby swing point.
Take Profit: Traders close the trade when all four reflect a trend change.
While this strategy won’t offer many entries throughout the day, it can help traders jump on trends with strong confirmation.
Relative Strength Index Supertrend Strategy
While the Relative Strength Index (RSI) is best known for its ability to spot overbought and oversold conditions, it can also help us confirm trends. The midpoint (50) is regarded as the defining boundary, with action above indicating bullishness and below demonstrating bearishness. Here, we’ve also increased the Supertrend multiplier to 5 to get a clearer picture of the trend.
Requirements: The default RSI with 14 periods and the Supertrend with a length of 10 and multiplier of 5.
Entry: When the Supertrend gives a bullish or bearish signal, traders confirm that the RSI is above or below 50, depending on the market direction. If both line up, traders may enter with a market order.
Stop Loss: Below or above a nearby swing point, depending on the market direction.
Take Profit: Traders close the trade when the Supertrend switches or if the RSI is above 70 or below 30, indicating extreme overbought or oversold conditions.
The advantage of using the RSI is that traders can anticipate trend reversals when the indicator reads overbought or oversold or when divergences appear.
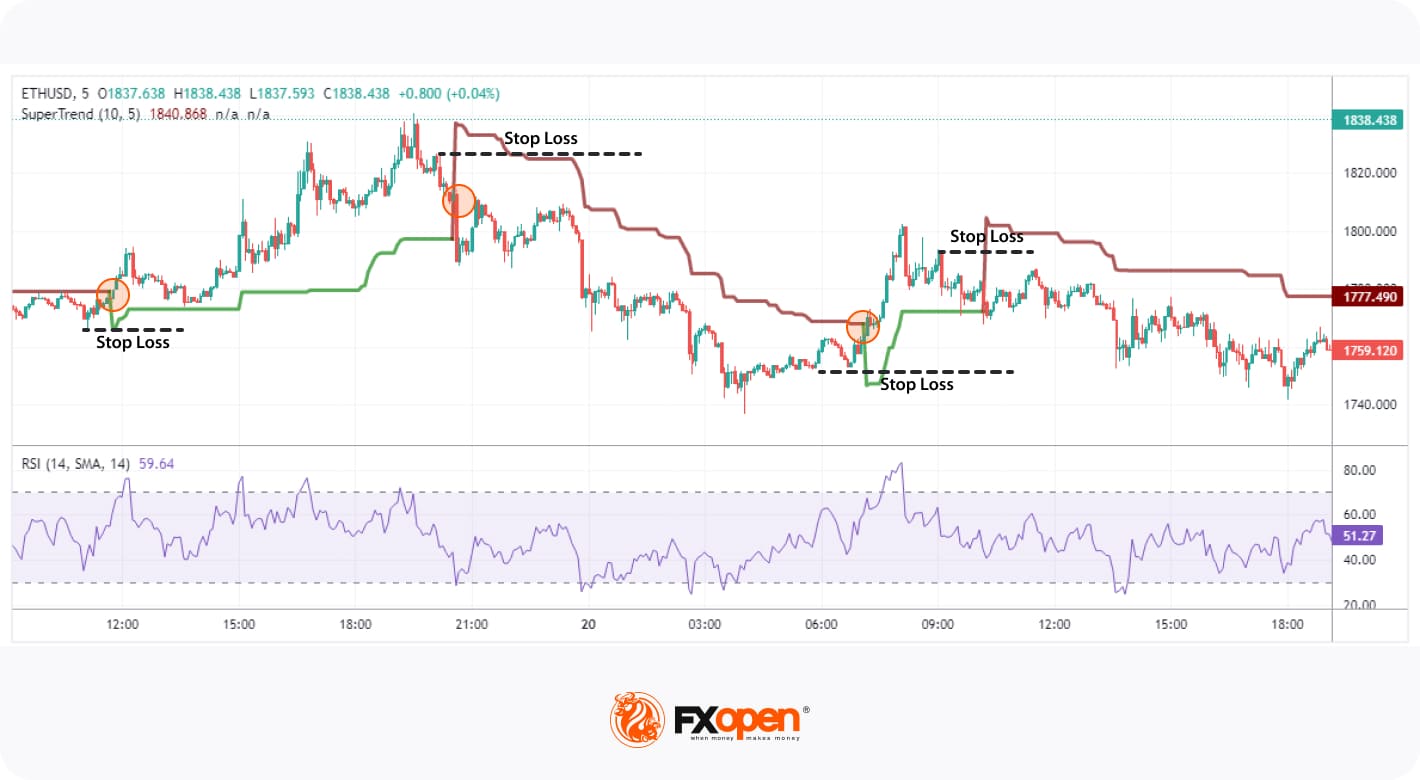
Stochastic Supertrend Strategy
The Stochastic indicator is similar to the RSI, helping traders spot overbought and oversold conditions. However, it provides these signals more often, offering us a way to confirm Supertrend signals and entries.
Requirements: The default Stochastic indicator, with settings 14, 1, and 3 and the Supertrend with a multiplier of 5.
Entry: After the Supertrend signals a certain direction, traders wait for the first time Stochastic reaches below 20 if bullish or above 80 if bearish to enter with a market order. Traders avoid trading if it’s not the first time.
Stop Loss: Below or above a nearby swing low or high, depending on the trade direction.
Take Profit: Traders close the trade when the Supertrend changes colours.
The Stochastic indicator allows traders to identify areas where the market is likely to reverse and, when combined with the Supertrend, can assist us in finding optimal entries with strong confirmation.
Advantages and Disadvantages of the Supertrend Indicator
The Supertrend indicator is a popular tool among traders for identifying market trends. However, like any trading tool, it has its strengths and limitations. Below are the main advantages and disadvantages of using the Supertrend indicator:
Advantages
- Easy to Understand: The Supertrend provides clear buy and sell signals, making it accessible to traders with any level of experience.
- Works Across Timeframes: It’s adaptable to various timeframes, from intraday charts to longer-term charts, making it suitable for day traders and swing traders alike.
- Dynamic Support/Resistance: The indicator often acts as a dynamic support or resistance level, helping traders determine entry and exit points.
- Trend Identification: The Supertrend excels at identifying strong market trends.
- Adjustable Settings: With customisable ATR and multiplier settings, traders can fine-tune the indicator to suit different market conditions or assets.
Disadvantages
- Lagging Indicator: Since it’s based on historical data, the Supertrend may react slowly, causing traders to enter late or miss the beginning of trends.
- False Signals in Ranging Markets: In sideways or ranging markets, the Supertrend tends to produce false signals, which may lead to potential losses.
- Limited Use as a Standalone Tool: While effective in trends, the Supertrend is not 100% reliable on its own and is used with confirmation tools like RSI or moving averages.
- Sensitivity Issues: Adjusting the multiplier and ATR values to find the best possible settings for the Supertrend indicator can increase the number of false signals or missed opportunities, making it tricky to find the balance.
The Bottom Line
The Supertrend indicator is a versatile tool that can help traders take advantage of new trends. The indicator isn’t exclusive to crypto; you can apply and adjust it to any market you see fit, including forex, commodities, and stocks. If you’re thinking of implementing Supertrend strategies, open an FXOpen account. You will access over 600 markets in the highly customisable TickTrader trading platform alongside low-cost trading and tight spreads. Just complete the signup process to get started. Good luck!
FAQ
How Can You Use a Supertrend Indicator?
To use the Supertrend indicator, traders apply it to price charts. Buy signals occur when the price rises above the Supertrend line, and sell signals are generated when the price falls below it. It serves as a dynamic support/resistance level in trending markets.
What Is Supertrend 7 3?
Supertrend 7 3 refers to a specific setting where the ATR period is set to 7, and the multiplier is set to 3. This configuration makes the indicator more sensitive to short-term price movements, often used by traders looking for tighter signals.
How Can You Avoid Supertrend False Signals?
To avoid false signals, traders combine the Supertrend indicator with other tools like the Stochastic Oscillator or moving averages. They also adjust the multiplier to reduce sensitivity in choppy markets, filtering out noise.
What Is the Supertrend Strategy for RSI?
In this strategy, Supertrend signals are confirmed by the RSI. If the Supertrend shows a buy signal and the RSI is above 50, it's a confirmation for a long position. Conversely, a sell signal with the RSI below 50 confirms bearish momentum.
What Is the ATR in Supertrend?
The ATR in Supertrend measures market volatility. By adjusting the ATR period and multiplier, traders can fine-tune the indicator’s sensitivity, balancing the number of signals and filtering out less significant price moves.
At FXOpen UK, Cryptocurrency CFDs are only available for trading by those clients categorised as Professional clients under FCA Rules. They are not available for trading by Retail clients.
This article represents the opinion of the Companies operating under the FXOpen brand only. It is not to be construed as an offer, solicitation, or recommendation with respect to products and services provided by the Companies operating under the FXOpen brand, nor is it to be considered financial advice.
Stay ahead of the market!
Subscribe now to our mailing list and receive the latest market news and insights delivered directly to your inbox.


Latest articles

Weekly Market Insights with Gary Thomson: US Inflation, UK GDP, Chair Warsh Testimony, and Earnings
In this video, we’ll explore the key economic events and market trends, shaping the financial landscape. Get ready for insights into financial markets to help you navigate the week ahead. Let’s dive in!
In this episode of Market

GBP/AUD Analysis: The Tug-of-War Begins
Oil is back in the driver's seat, and both the pound and the aussie are feeling its grip. The Bank of England held rates at 3.75% in June, but with UK inflation at 2.8% and crude oil climbing

Australian Dollar Holds Above the Current Market Profile
The minutes from the Reserve Bank of Australia's (RBA) June meeting, released on 30 June, suggested that policymakers are not yet ready to rule out further policy tightening. Board members noted persistent excess demand and broad-based inflationary pressures across the