


How to Use the Triple Bottom Pattern in Trading
FXOpen

Price action trading on charts refers to a trading strategy that relies on analysing the movement of the price and the patterns formed by it. The triple bottom is a price action pattern commonly observed in charts. In this article, we will discuss how traders may identify and trade with this formation.
What Is a Triple Bottom?
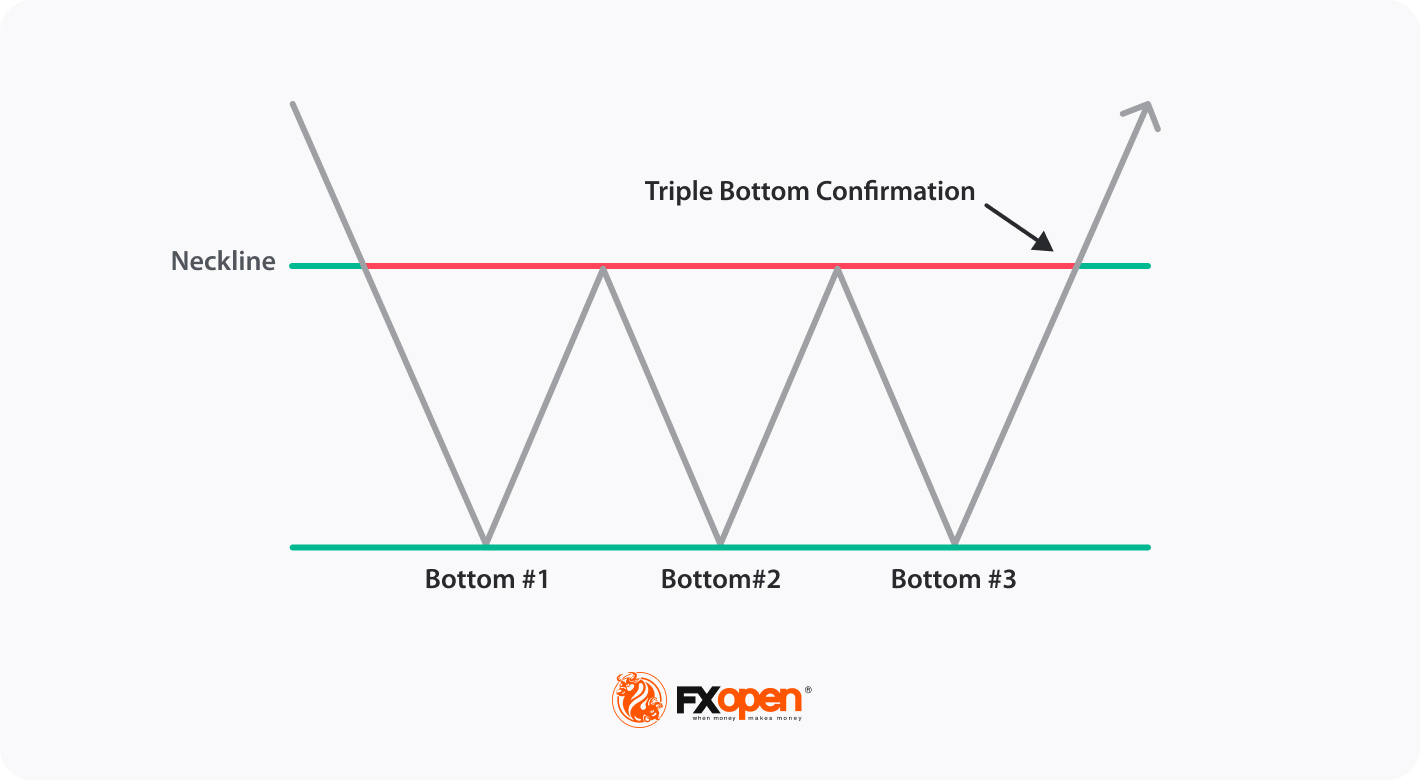
Writing a definition of the triple bottom line is simple. A triple bottom is a technical chart pattern commonly observed in financial markets. It is characterised by three consecutive lows at approximately the same price level, forming a "W" shape. Each bottom signifies a level at which buying pressure overcomes selling pressure, indicating support for the asset's price. The sustainability of the triple bottom line suggests a potential trend reversal from a downtrend to an uptrend. Traders often consider the triple bottom pattern for opening a buy position.
Differences Between a Triple Bottom and a Triple Top
In contrast with the triple bottom, a triple top pattern occurs during an uptrend and represents a bearish reversal pattern. It consists of three unsuccessful attempts to break above a resistance level, each accompanied by decreasing volume. This setup suggests a shift in power from buyers to sellers, indicating potential selling pressure and a trend change to the downside.
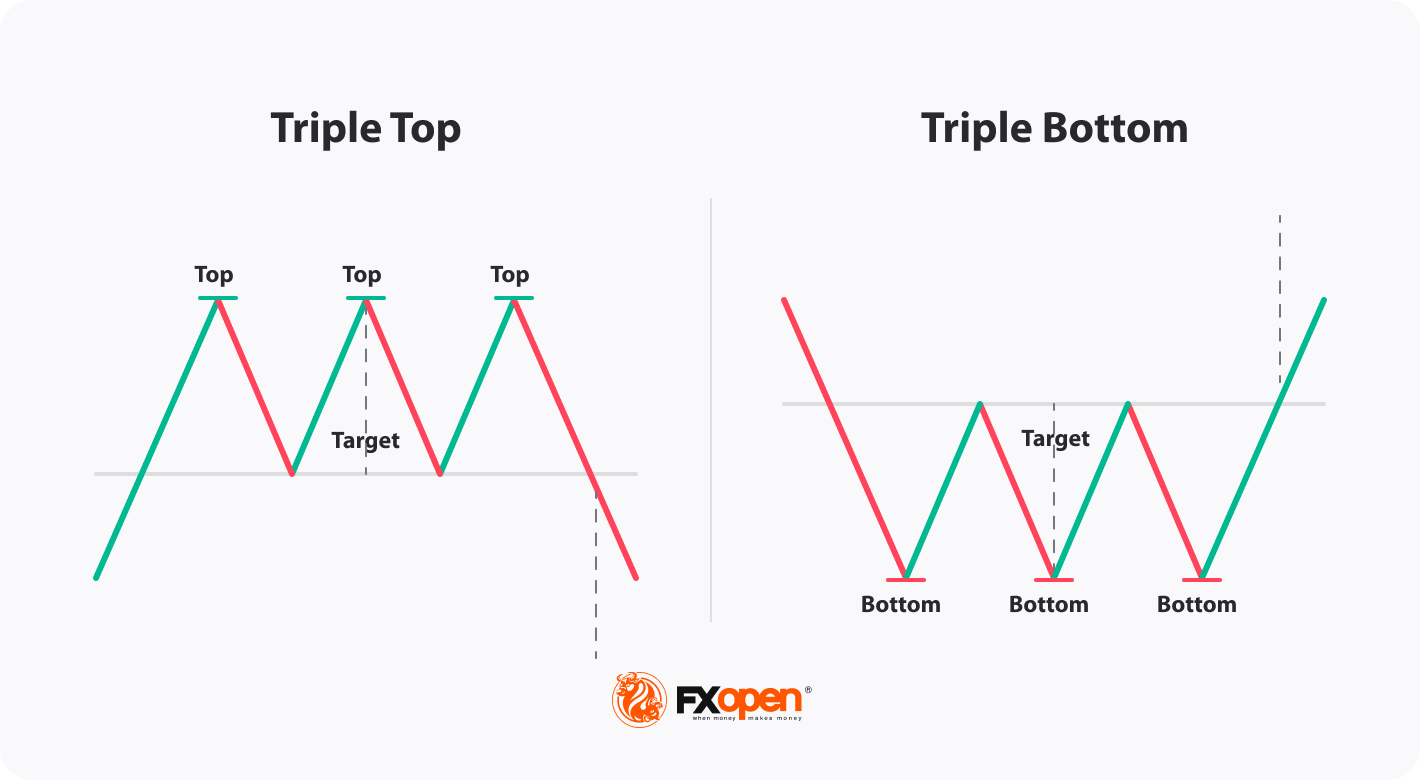
Here are the differences between the top and bottom formations:
How to Trade a Triple Bottom
Trading a triple bottom pattern involves identifying the formation, confirming its validity, and implementing a trading strategy based on the formation's potential bullish reversal. Here are some steps traders consider when spotting the triple bottom setup:
- Identify the setup: Traders look for a series of three significant lows formed at approximately the same support level after a solid downtrend.
- Determine entry point: Plan an entry point after the confirmation. According to the theory, a new uptrend is confirmed when the price breaks above the resistance level, the line drawn through two peaks formed between the bottoms.
- Set stop-loss: Traders use different approaches: the first one is to place a stop-loss order below the lowest point of the triple bottom, and another is to place it slightly below the resistance line. The choice depends on the risk-reward ratio. This will help limit potential losses if the formation fails to hold and the price continues to decline.
- Set price targets: A price target is usually based on the pattern's height. A trader may measure the distance from the lowest point of the formation to the resistance level and project that distance upward from the breakout point.
To trade this setup with minimal fees, traders may choose to open an FXOpen account.
An Example of Triple Bottom Trading
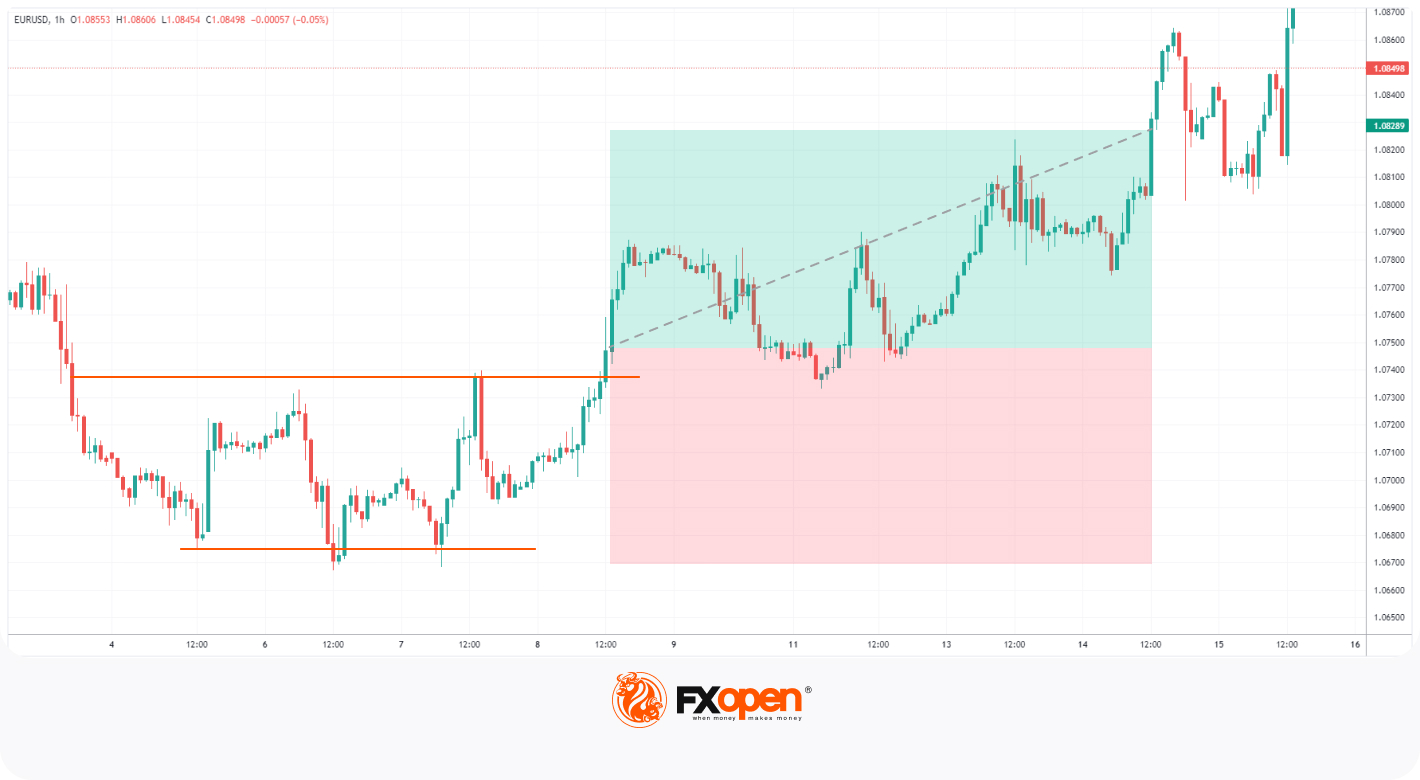
A trader identifies a triple bottom on the EURUSD chart. They enter the trade when the price breaks above the resistance line and place a stop loss below the setup. The take profit is set at a level similar to the height of the formation. In the example above, the risk/reward ratio is 1:1. It can be increased to lower risks by placing a stop-loss slightly below the resistance level.
Traders can examine how to identify triple top patterns for free on the FXOpen TickTrader platform. It supports multiple financial instruments and trading tools to help with your analysis.
Final Thoughts
By correctly identifying the setup, confirming its validity, and implementing appropriate entry, stop-loss, and price target strategies, traders may aim to validate potential price increases following the formation of a triple bottom. However, it's important to consider additional factors such as volume, overall market conditions, and risk management techniques when making trading decisions.
Developing a comprehensive trading plan and continually learning and adapting to market dynamics will contribute to more informed trading outcomes. FXOpen offers attractive trading opportunities with the aim of making your trading more effective.
FAQ
Is a Triple Bottom Bullish or Bearish?
A triple bottom is considered a bullish reversal pattern in technical analysis. It typically occurs after a prolonged downtrend and consists of three significant lows at approximately the same price level. The pattern suggests that selling pressure is diminishing, and buyers are gaining strength, potentially leading to a trend reversal to the upside.
What Happens After a Triple Bottom?
After the formation, traders often look for confirmation signals, such as a breakout above the resistance level formed by the highs between the three bottoms. This breakout can indicate a shift in market sentiment, leading to a bullish trend. However, it is important to note that patterns are not infallible, and other factors are always considered before making trading decisions.
Is a Triple Top Pattern a Good Sign?
A triple top is a bearish reversal pattern that is considered a good sign for a bearish reversal. The setup suggests that buying interest is weakening, and sellers may gain control, potentially leading to a trend reversal to the downside.
This article represents the opinion of the Companies operating under the FXOpen brand only. It is not to be construed as an offer, solicitation, or recommendation with respect to products and services provided by the Companies operating under the FXOpen brand, nor is it to be considered financial advice.
Stay ahead of the market!
Subscribe now to our mailing list and receive the latest market news and insights delivered directly to your inbox.


Latest articles

US Dollar Index: A Defining Week for the King of the Markets
The dollar heads into a pivotal week trading near 101.80, just off a 15-month high, with the Fed's July 29 meeting standing as the clear focal point. Markets currently price roughly a 65% chance of a hold, though renewed

NZD/USD: Inflation Surge Meets Strong US Dollar Pressure
On 21 July, Stats NZ reported an acceleration in inflation: the Consumer Price Index rose 1.5% in the second quarter, while the annual inflation rate climbed to 4.1%, its highest level in more than two years and slightly

Weekly Market Insights with Gary Thomson: The Week of Central Banks and Earnings
In this video, we’ll explore the key economic events and market trends, shaping the financial landscape. Get ready for insights into financial markets to help you navigate the week ahead. Let’s dive in!
In this episode of Market