


Litecoin Breaks $50 Dollars
FXOpen

Time for another crypto update. Unlike most weeks, this time we have Litecoin outperforming Bitcoin. While BTC prices remain mired in a trading range, the LTC pump continues. We’re now quoted at $49 dollars per coin after previously trading above the $50 mark. But let’s cover big brother first and we’ll come back to litecoin later in this article.
Bitcoin Still in Range
Bitcoin prices are still in range on the daily charts. During the past seven days, we bottomed at a low of $2,326, just above the important $2,250 level. A break below here would’ve triggered a new BTC downtrend.
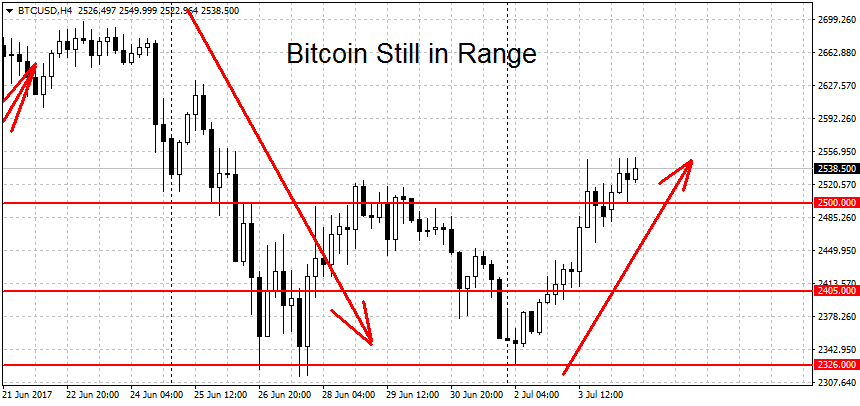
As things stand now, however, we remain locked in a range. The bulls need a breakout above $2,750 on FXOpen. This would shift the trend back to the upside. This level corresponds to around $2,800 on other major exchanges. During upmoves FXOpen and BTC-E prices tend to lag a bit behind the majors. Currently, this ‘gap’ is around $70 dollars but it could get as high as $100 dollars or more if the trend accelerates. Higher up the $3,000 figure (around $2,900 on FXOpen) will be the next major milestone. A clean breakout above here could lead to extended gains for the bulls.
On the bottom end, the level to watch remains at $2,250. A breakdown below it would start a new bearish trend for BTC/USD. On the long-term charts (weekly and monthly) in Metatrader bitcoin is still in an uptrend.
Litecoin Breaks $50 Dollars
Litecoin prices had a great run today, rallying from $44 to just above $50 dollars per coin. This extends the bullish trend we’ve been in since the middle of June.
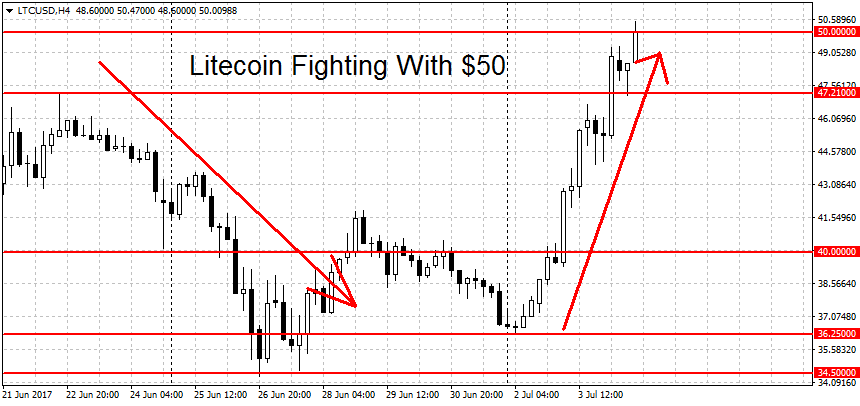
Litecoin is now at a major milestone level. We’re at all-time highs here and coupled with the round figure at $50 this is strong resistance. Prices rallied up to here and failed to break above just two weeks earlier. If they manage to go higher this time around, we should get accelerate gains in LTC/USD. Keep in mind that a lot of games are being played around important levels like these, with traders trying to run stops both ways. It’s not as easy to trade the breakout (or failed breakout) is it seems at first glance.
The bull run on the daily charts will remain in place until the bears manage to take us below the $34.40 level. This was the breakout point for the current rally. A move back below it should end the upmove. On the weekly and monthly charts, LTC/USD stayed bullish for the past few months.
FXOpen offers the world's most popular cryptocurrency CFDs*, including Bitcoin and Ethereum. Floating spreads, 1:2 leverage — at your service (additional fees may apply). Open your trading account now or learn more about crypto CFD trading with FXOpen.
*Important: At FXOpen UK, Cryptocurrency trading via CFDs is only available to our Professional clients. They are not available for trading by Retail clients. To find out more information about how this may affect you, please get in touch with our team.
This article represents the opinion of the Companies operating under the FXOpen brand only. It is not to be construed as an offer, solicitation, or recommendation with respect to products and services provided by the Companies operating under the FXOpen brand, nor is it to be considered financial advice.
Stay ahead of the market!
Subscribe now to our mailing list and receive the latest market news and insights delivered directly to your inbox.


Latest articles

DAX 40: consolidation amid technology sell-off
A wave of selling in the technology sector that emerged earlier this week has weighed on European equities. The trigger was investor concern over the profitability of large-scale debt-funded investments by major US tech companies in AI infrastructure. The Nasdaq

Euro Hits Fresh Yearly Lows Amid Dovish ECB Signals
The euro remains under pressure following weak macroeconomic data from the euro area and fresh signals that the European Central Bank is prepared to maintain a more accommodative monetary policy stance. Data released yesterday pointed to a deterioration in business

Pound at Key Levels: Markets Assess Impact of Political Uncertainty in the UK
The British pound remains under pressure following increased political uncertainty in the United Kingdom triggered by the Prime Minister’s resignation. Investors are assessing potential shifts in the political and economic policy outlook after the head of government stepped down,