


Litecoin Surges on Segwit Deal
FXOpen
A last minute segwit deal between the Litecoin creator and miners lead to a surge in LTC prices. Bitcoin did okay too, up by $31 dollars or 2.5 percent since last Tuesday.
Litecoin Surges on Segwit Deal
The Litecoin creator and Charlie Lee and holdout miners reached a compromise deal on April 22nd. According to the circulated announcement, the miners will signal segwit in exchange for a ‘bigger blocks’ solution. The bigger blocks fix will happen when they are over 50% full, which is probably many years in the future. Most LTC blocks are currently well below the 1 MB maximum.
From a fundamental perspective, it’s not clear for a cryptocurrency trader that the segwit upgrade by itself justifies the nearly five-fold increase in prices during the past month. The main ‘selling point’ of segwit is the smaller footprint, which frees up space for more transactions. But unlike Bitcoin where blocks are frequently full, this almost never happens on Litecoin. In addition, the 2.5-minute blocks (compared to 10 minutes for BTC) theoretically allows for 4 times as many LTC transactions during the same timeframe.
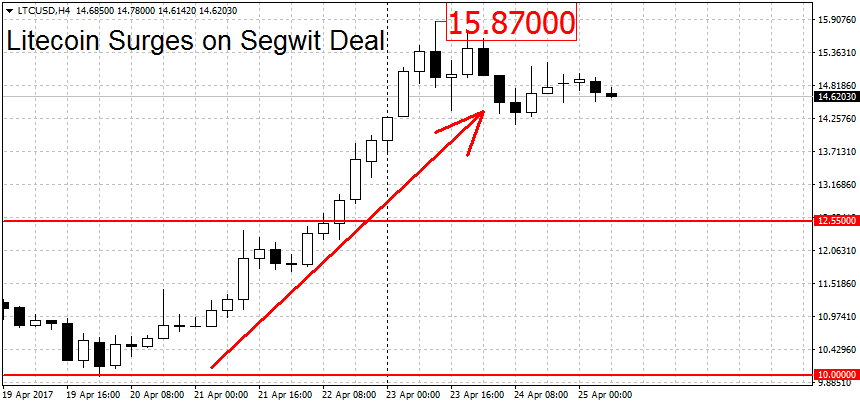
Prices hit a high of $13.98 on the day of the deal and continued to rise slowly in the next few days. Two days ago a new high of $15.87 was reached. We are currently quoted at $14.62 dollars per coin. While fundamentally the reasons for the rally seem spurious, technically we’re still in an uptrend. To end it, the bears will have to push LTC/USD below the $10 round figure. The longer-term weekly and monthly charts remain bullish.
Bitcoin Inches Higher
More gains for bitcoin this week as prices inched higher from $1,214 to $1,245. A large part of the pulling higher could be to on-going withdrawal problems at Bitfinex. The troubled exchange is quoting prices at $1,348 dollars right now. This compares to $1,245 on Fxopen or $1,254 on Bitstamp. The gap has grown from $70 last week to an average of $100 right now. As of now, Bitfinex fiat withdrawals remain largely unavailable, although the exchange is working on an ‘innovative’ one-off solution to dispense funds.
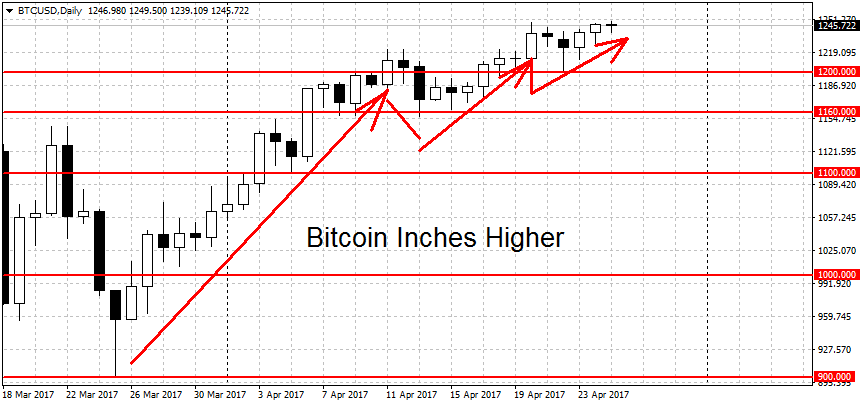
Similarly to LTC, the current bitcoin rally seems to be built on shaky foundations. But you can’t argue with the charts. The trend is up and it will remain so until we get a decisive breakdown below $1,160 dollars per coin. A move below the $1,100 round figure would switch the current trend from bullish to bearish. On the long-term charts (weekly and monthly) BTC/USD is pointing upward as well.
FXOpen offers the world's most popular cryptocurrency CFDs*, including Bitcoin and Ethereum. Floating spreads, 1:2 leverage — at your service (additional fees may apply). Open your trading account now or learn more about crypto CFD trading with FXOpen.
*Important: At FXOpen UK, Cryptocurrency trading via CFDs is only available to our Professional clients. They are not available for trading by Retail clients. To find out more information about how this may affect you, please get in touch with our team.
This article represents the opinion of the Companies operating under the FXOpen brand only. It is not to be construed as an offer, solicitation, or recommendation with respect to products and services provided by the Companies operating under the FXOpen brand, nor is it to be considered financial advice.
Stay ahead of the market!
Subscribe now to our mailing list and receive the latest market news and insights delivered directly to your inbox.


Latest articles

Amazon Earnings: Does the Chart Already Know Something the Numbers Don't?
All eyes are on July 30, when Amazon reports Q2 2026 earnings, with Wall Street increasingly convinced the bar has been set too low. Consensus sees EPS near $1.82-$2.26 on roughly $197 billion in revenue, but the

WTI Analysis: Gap Breaks Short-Term Trend as Price Remains Trapped Between the POC and Profile Boundary
WTI crude oil plunged by more than 7% on 27 July 2026 after the US suspended a series of strikes against Iran over the weekend, raising hopes of a diplomatic solution and the reopening of shipping through the Strait of

US Dollar Index: A Defining Week for the King of the Markets
The dollar heads into a pivotal week trading near 101.80, just off a 15-month high, with the Fed's July 29 meeting standing as the clear focal point. Markets currently price roughly a 65% chance of a hold, though renewed