


LTC and EOS — Establishing Support
FXOpen

LTC/USD
The price of Litecoin has been decreasing since last Friday when it was sitting at $60.58 and depreciated in value by 13.42% measured to its lowest point today at $52.36 around which it is currently being traded.
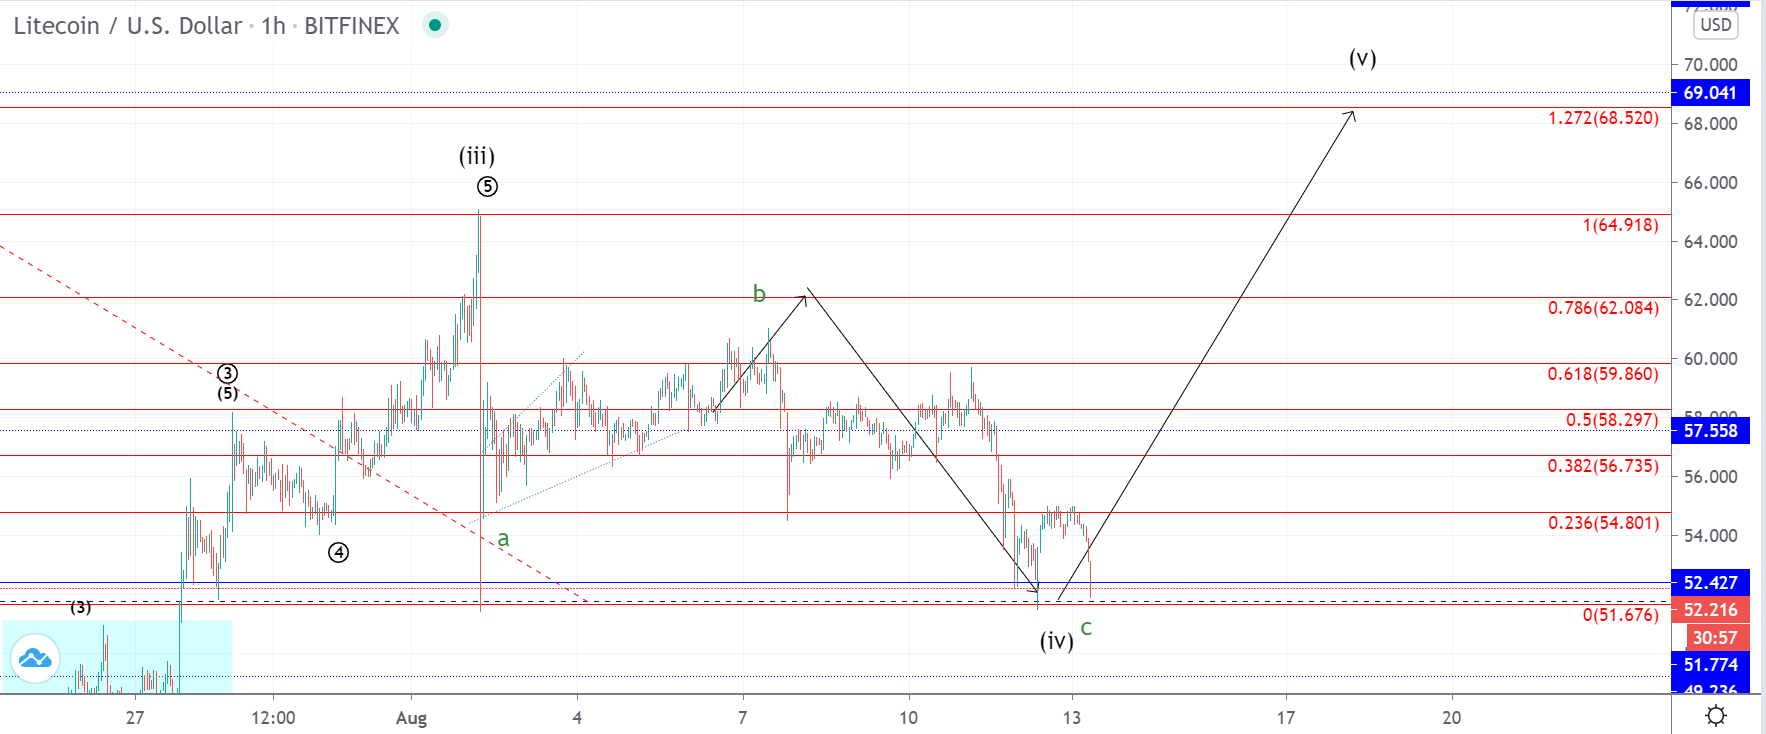
On the hourly chart, you can see that the price came down to the projected level which is the Fibonacci line that was made on the first impulsive decline on the 2nd of August and was the local support level from the 3rd wave of the lower degree count.
This could indicate that the corrective ABC move which is the sub-wave of the higher degree 4th wave correction has been completed as a retest of the support level before another impulsive move to the upside as the 5th wave starts.
Another possibility could be that the price could continue decreasing a bit longer below the currently interacted Fib level but since the C wave is sub-divided into a five-wave structure and already started looking like completed the descending move wouldn’t be expected to continue much longer below the $50 mark.
This is why shortly after the further establishment of support the price would be expected to begin another upside move that would result in a higher high compared to the one made on the 2nd of August and could lead the price of Litecoin to around $70.
EOS/USD
From Tuesday when the price of EOS came up to $3.2787 at its highest point we have seen a decrease of around 12% as it came down to $2.885 and even continued to spike a bit further to the downside but the hourly candle snapped back above the significant horizontal support zone above the $2.9282 level.
At the moment this upper level of the horizontal support zone has been retested again and with the price finding support, we are seeing another wick from the buyer’s side indicating that the support is still present.
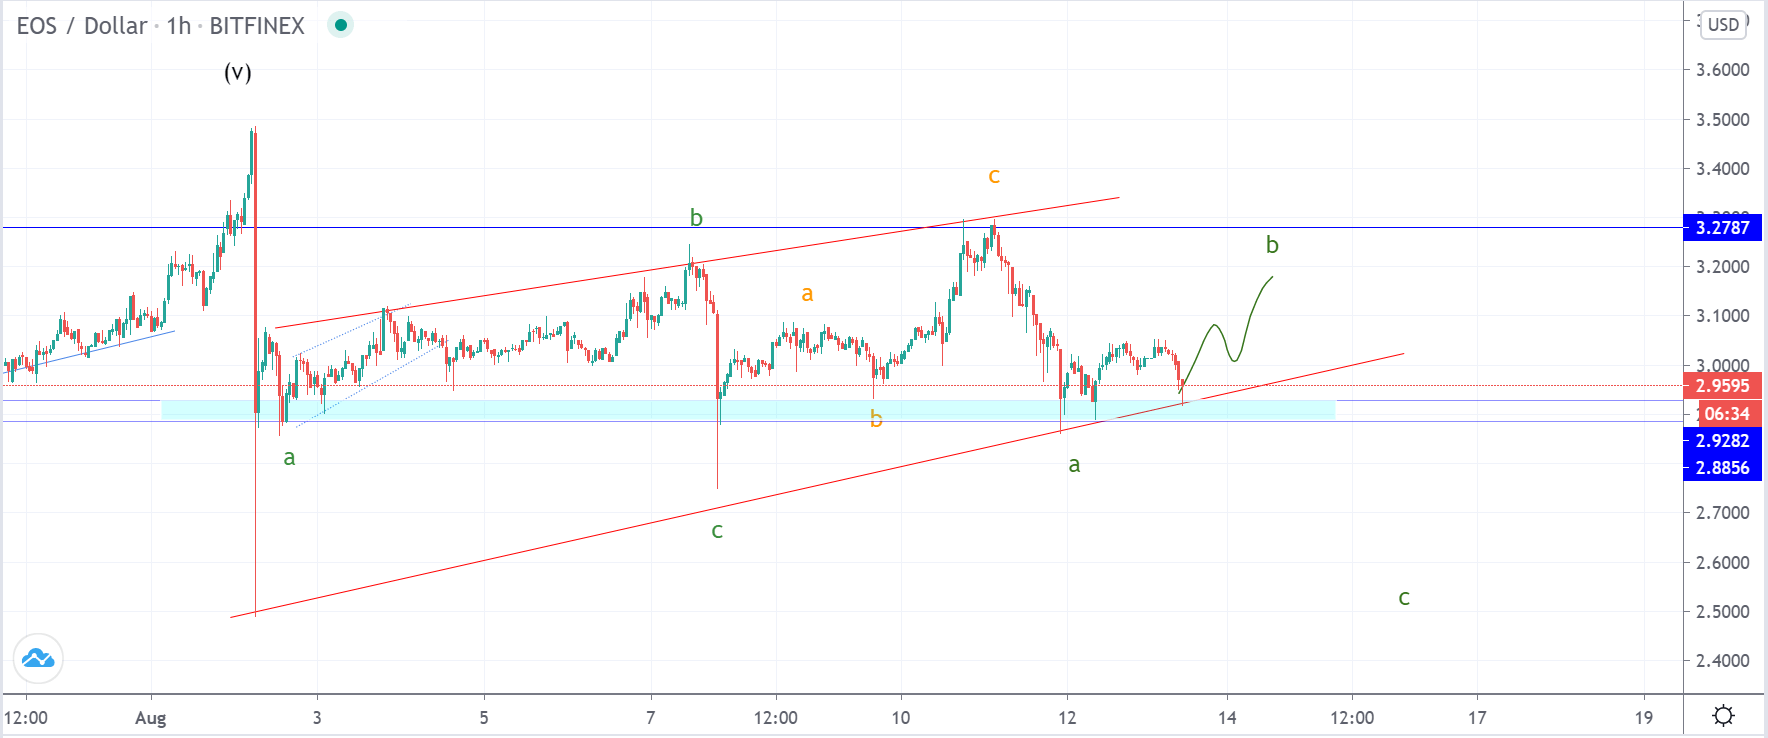
On the hourly chart, we can see that the price of EOS has undergone corrective sideways action since the 2nd of August and has made a three-wave move to the downside, followed by a three-wave move to the upside that was completed on Tuesdays high.
This is why now we are most likely seeing the development of the next three-wave move to the downside which would be the 3rd wave of the higher degree corrective count and would lead the price of EOS into a breakout below its significant horizontal zone.
First, as we are seeing that the support held another corrective move in the form of a B wave would be expected but only to around the median point of the current range. If the price continues increasing from here and manages to move above Tuesday’s high the count would be invalidated.
FXOpen offers the world's most popular cryptocurrency CFDs*, including Bitcoin and Ethereum. Floating spreads, 1:2 leverage — at your service (additional fees may apply). Open your trading account now or learn more about crypto CFD trading with FXOpen.
*Important: At FXOpen UK, Cryptocurrency trading via CFDs is only available to our Professional clients. They are not available for trading by Retail clients. To find out more information about how this may affect you, please get in touch with our team.
This article represents the opinion of the Companies operating under the FXOpen brand only. It is not to be construed as an offer, solicitation, or recommendation with respect to products and services provided by the Companies operating under the FXOpen brand, nor is it to be considered financial advice.
Stay ahead of the market!
Subscribe now to our mailing list and receive the latest market news and insights delivered directly to your inbox.


Latest articles

DAX 40: consolidation amid technology sell-off
A wave of selling in the technology sector that emerged earlier this week has weighed on European equities. The trigger was investor concern over the profitability of large-scale debt-funded investments by major US tech companies in AI infrastructure. The Nasdaq

Euro Hits Fresh Yearly Lows Amid Dovish ECB Signals
The euro remains under pressure following weak macroeconomic data from the euro area and fresh signals that the European Central Bank is prepared to maintain a more accommodative monetary policy stance. Data released yesterday pointed to a deterioration in business

Pound at Key Levels: Markets Assess Impact of Political Uncertainty in the UK
The British pound remains under pressure following increased political uncertainty in the United Kingdom triggered by the Prime Minister’s resignation. Investors are assessing potential shifts in the political and economic policy outlook after the head of government stepped down,