


FXOpen

LTC/USD
On Monday the price of Litecoin has continued it’s upward trajectory until reaching $50 mark after a sharp downfall of 11.2% has been made with the price falling down to $44.3 in a matter of hours. Since then a significant recovery has been made with the price making back to $48.1 at its highest point today around which it’s currently being traded.
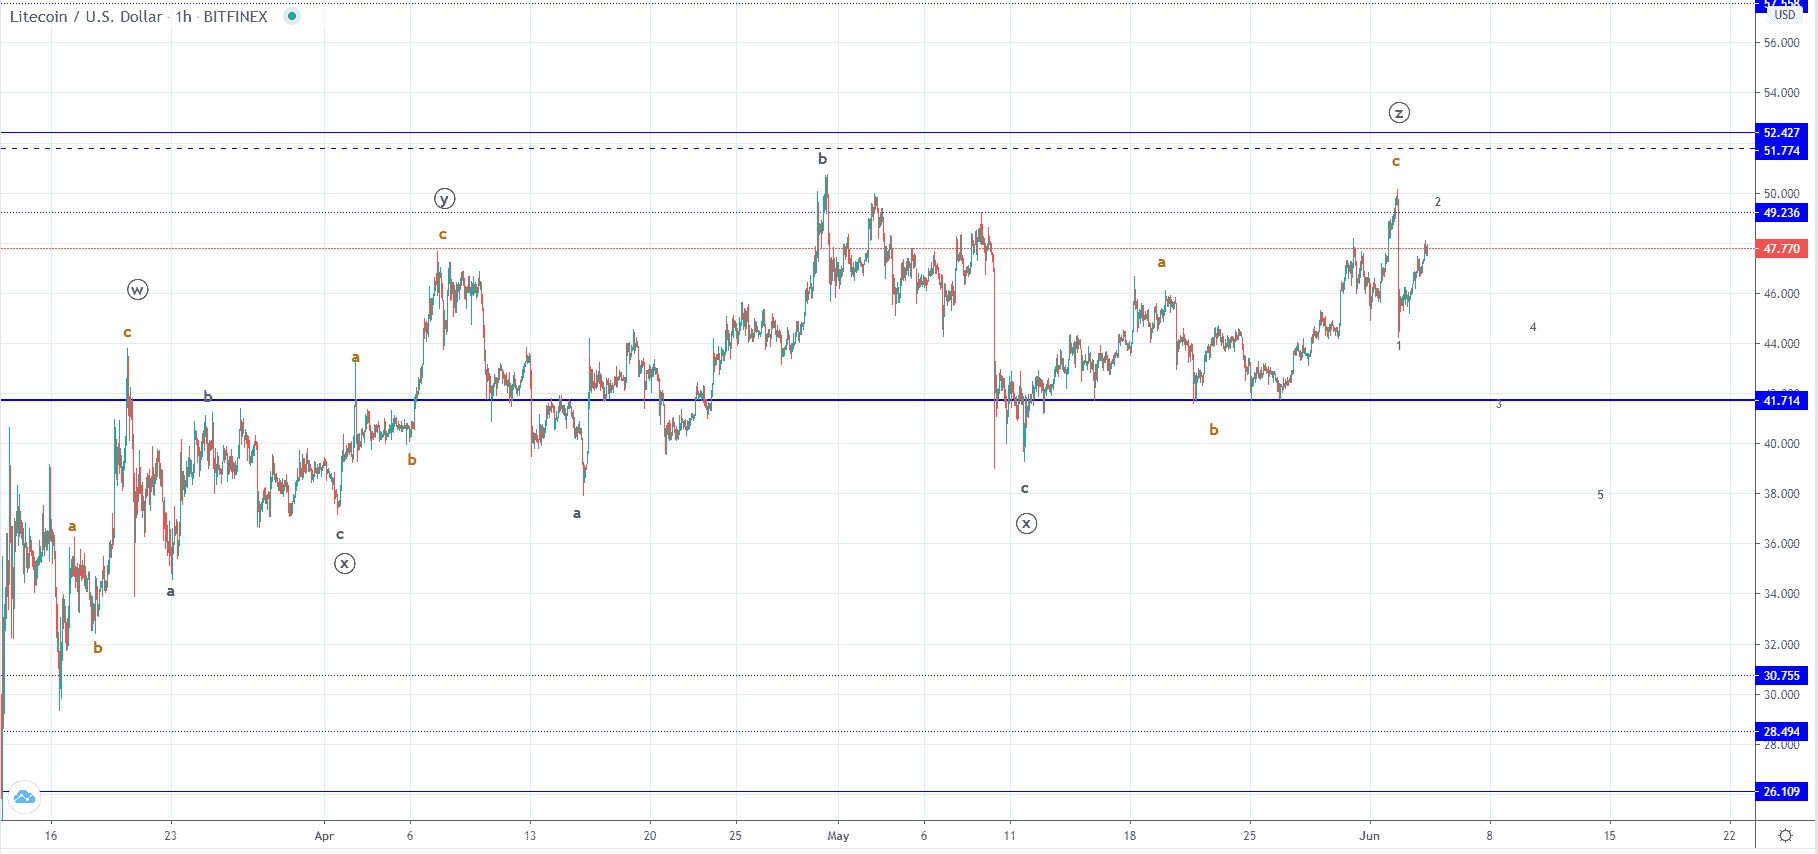 On the hourly chart, you can see that we have seen an attempt for a higher high on Monday compared to May’s one slightly above the $50 mark but as the price entered the seller’s territory an impulsive downside move has been seen. From the retest of the significant horizontal level at $41.7 when the price found the support, we have seen a five-wave move to the upside which has most likely been the completion of the C wave from the three-wave ABC correction to the upside.
This is why now I believe we are to see the continuation of the descending movement whose start was indicated but the impulsive spike made on Monday being its 1st sub-wave. More so as it appears that the whole choppy ascending price action from the 16th of March has been corrective in nature and has now most likely ended. If this is true then the expected five-wave move that has been outlined on the hourly chart would only be the 1st sub-wave of a lower degree count with the price continuing to downtrend after.
Another possibility could be that another retest of the vicinity of the previous high could be made especially as the price hasn’t reached the significant horizontal resistance levels at around $51.77 before the start of the descending move but would, in that case, mean that the Monday’s downward spike hasn’t been the 1st sub-wave of the next five-wave move to the downside.
EOS/USD
Like in the case of Litecoin, the price of EOS has also been following a similar pattern as it sharply fell on Monday slightly over 10% coming from $2.89 to $2.6 at its lowest point from where it started recovering. At the moment it is being traded at $2.73 and is still in an upward trajectory.
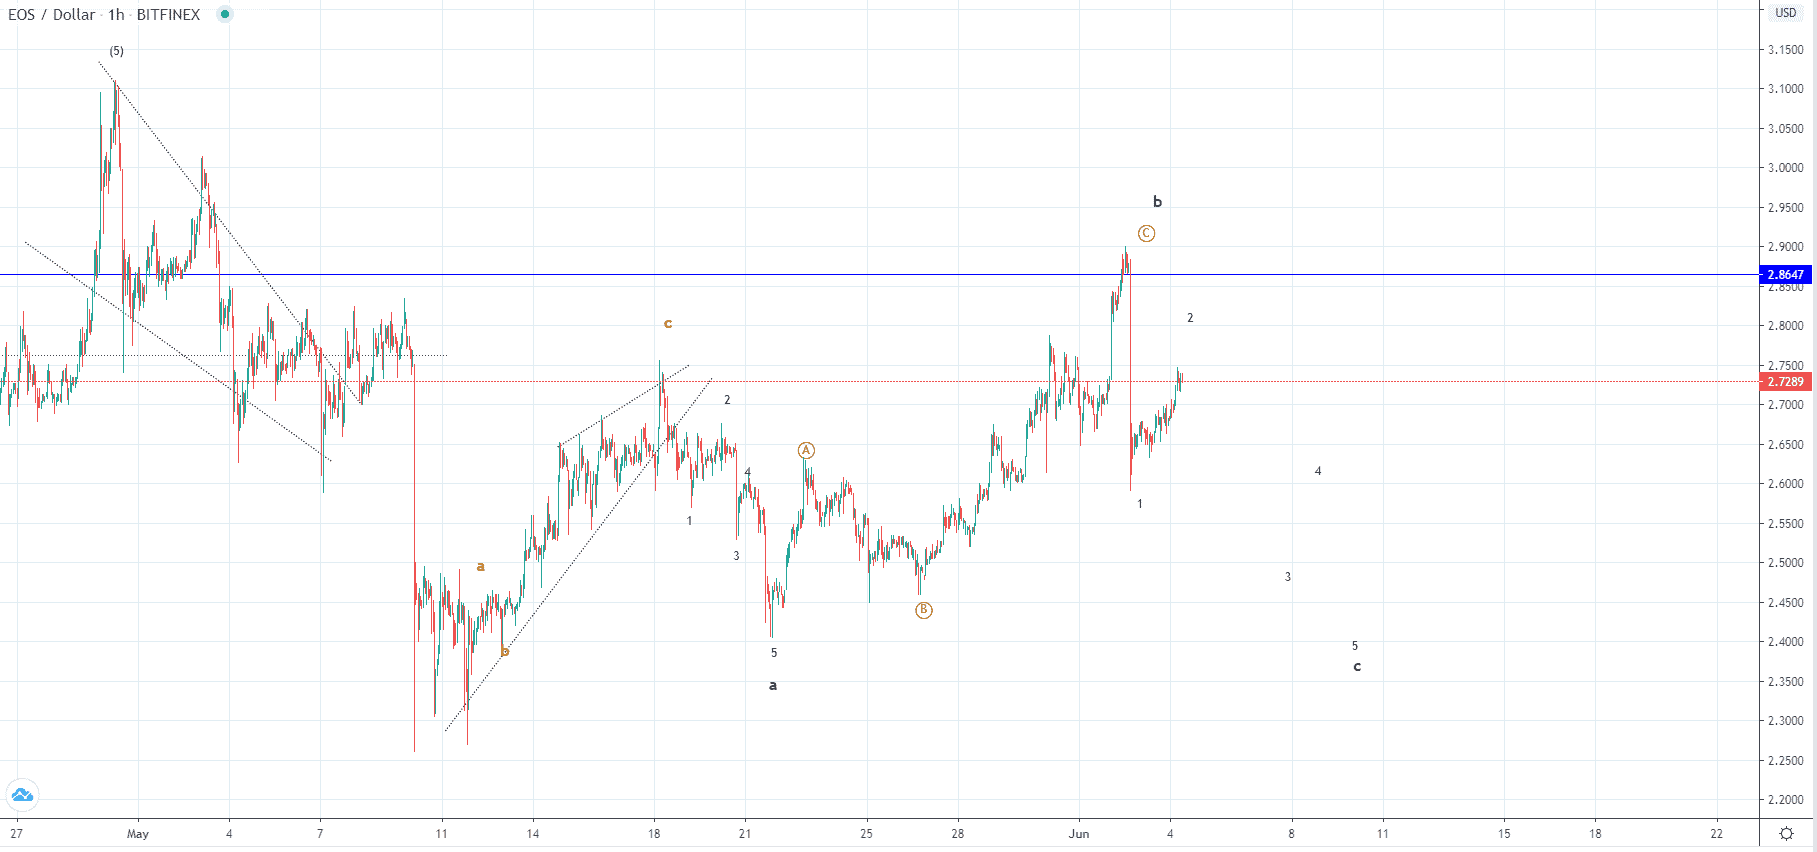 Looking at the hourly chart, you can see that the price made an attempt to go above the significant horizontal level at $2.86 but as it started entering the upper range, the seller’s pressure has been activated. This is why an impulsive move to the downside has been seen which has likely meant the beginning of the next descending impulse which is likely to lead the price of EOS back to the vicinity of the prior low at around $2.37.
There is a possibility that the current recovery could continue for a bit longer after a minor retracement and make another attempt for a breakout to the upside before the descending impulse wave starts developing but it is more likely that we have already seen it’s beginning.
FXOpen offers the world's most popular cryptocurrency CFDs*, including Bitcoin and Ethereum. Floating spreads, 1:2 leverage — at your service (additional fees may apply). Open your trading account now or learn more about crypto CFD trading with FXOpen.
*Important: At FXOpen UK, Cryptocurrency trading via CFDs is only available to our Professional clients. They are not available for trading by Retail clients. To find out more information about how this may affect you, please get in touch with our team.
This article represents the opinion of the Companies operating under the FXOpen brand only. It is not to be construed as an offer, solicitation, or recommendation with respect to products and services provided by the Companies operating under the FXOpen brand, nor is it to be considered financial advice.
Stay ahead of the market!
Subscribe now to our mailing list and receive the latest market news and insights delivered directly to your inbox.


Latest articles

Market Insights with Gary Thomson: Where Are Oil, Gas & Global Indices Heading?
In this video, we’ll explore the key economic events and market trends, shaping the financial landscape. Get ready for insights into financial markets to help you navigate the week ahead. Let’s dive in!
In this episode of Market

Netflix (NFLX) Shares Pull Back After a 30% Surge
On 21 January, while analysing the NFLX chart, we:
→ identified a descending channel and a resistance zone around the $100 level;
→ noted that Netflix shares were showing a sustained downtrend. Selling pressure had been triggered primarily by reports of a

US Dollar Index (DXY) Rises Above the 100 Level
Today the US Dollar Index (DXY) climbed above the psychological 100 mark for the first time in 2026, supported by a tense fundamental backdrop, with the military conflict in the Middle East acting as the main driver.
→ Financial market participants