


FXOpen

LTC/USD
From last Friday when the price of Litecoin has been sitting around $62.332 at its lowest point we have seen an increase of 13.61% until Tuesday when it came up to $70.8 at its highest point but is currently sitting at $67 as a minor retracement occurred.
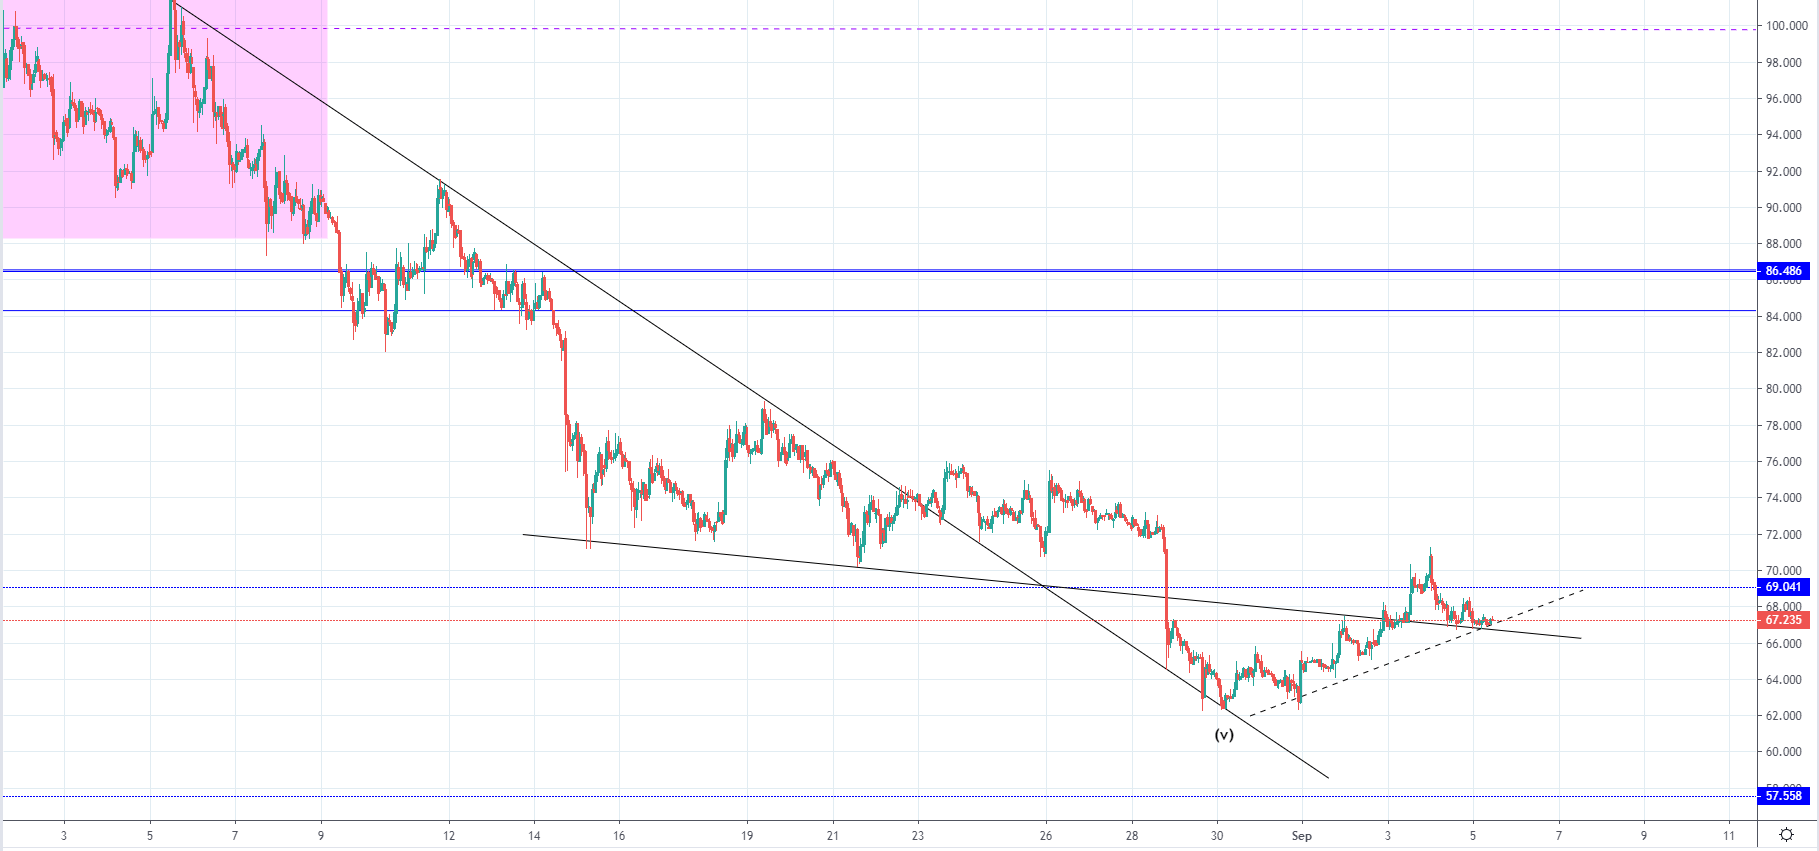 Looking at the hourly chart, you can see that the price attempted to make a recovery above the $69 horizontal level but the attempt ended as a fakeout with the price currently retesting its support point made by the intersection of multiple trendlines. After the price continued moving below the $69 level it hasn’t continued doing so for much longer before recovery started which could indicate that we’ve seen the ending wave from the five-wave move to the downside that started on the 22nd of June at the yearly high.
If we’ve seen the ending wave from the five-wave move to the downside the recovery which started could lead to a significant one as the price of Litecoin decreased by over 56% from its yearly high. But if the five-wave decrease hasn’t ended this recovery could only be a minor one before the downtrend continuation. This is why the $69 level is serving as a pivot point above which it is considered as the seller’s territory so if the price manages to move back above it and stays there the likelihood of a significant recovery would be higher.
If however the price gets rejected here and starts moving impulsively to the downside again the likelihood of the downside movement continuing would be higher.
EOS/USD
From last Thursday when the price of EOS was sitting at around $3 at its lowest point we’ve seen a recovery of 12.3% until Tuesday this week when the price came up $3.45 at its highest. The price is currently being traded at around $3.27 as a minor retracement occurred to the horizontal support level which was broken on the way down. 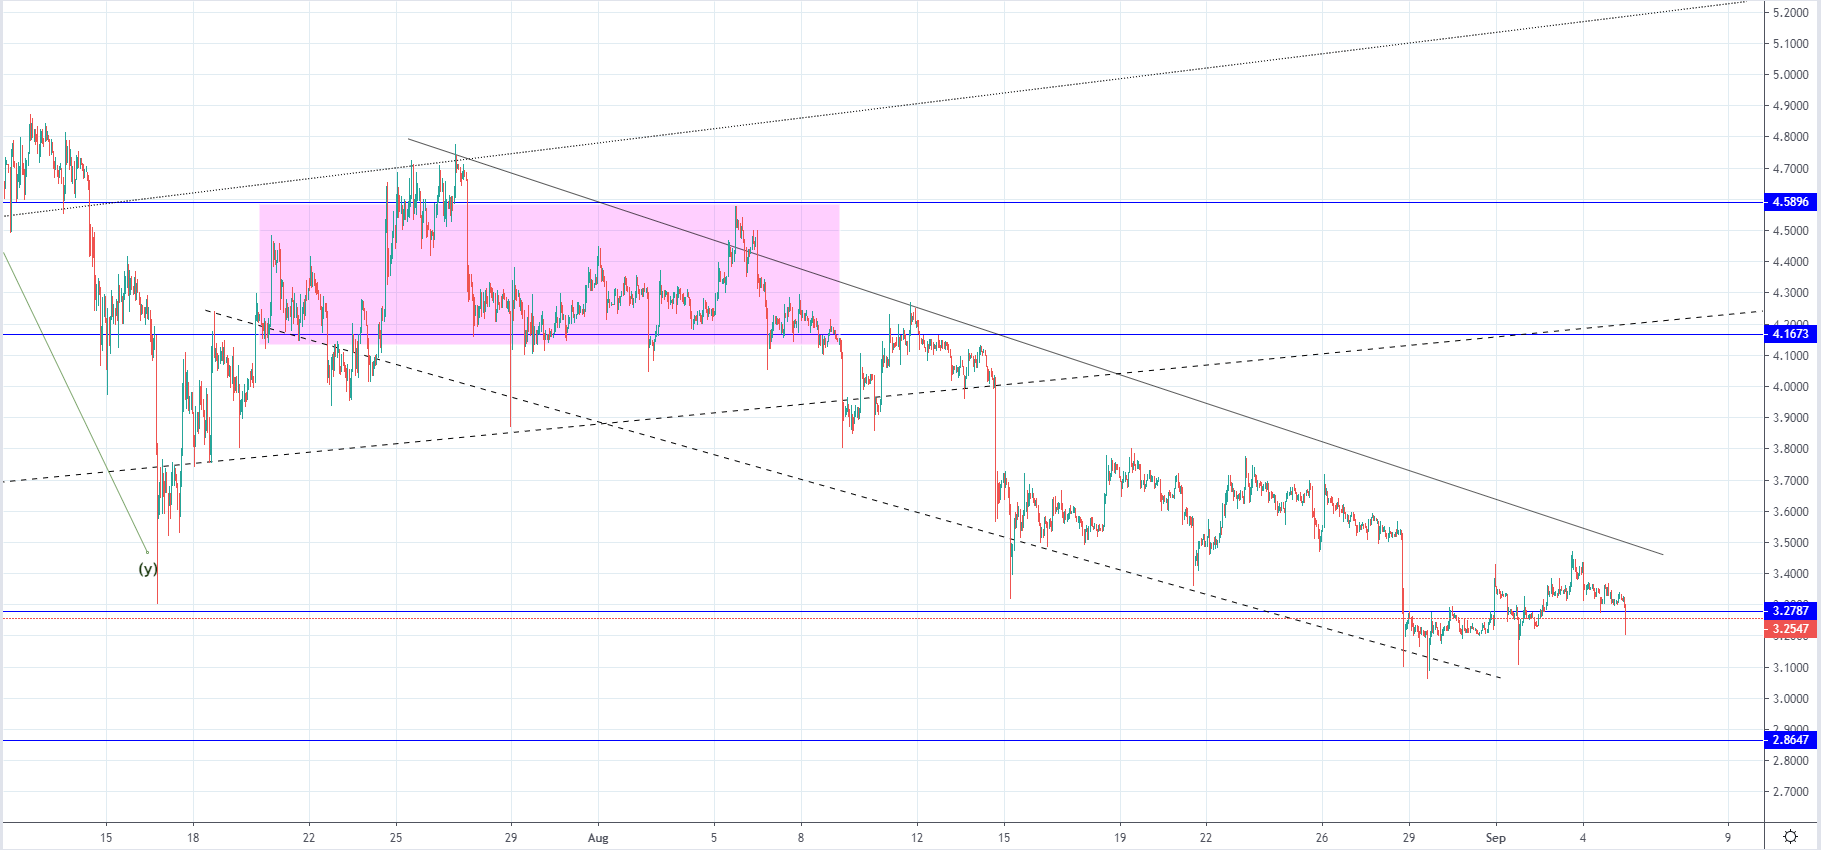 On the hourly chart, you can see that the price has managed to move back up above the significant horizontal level and is now retesting it for support which is why if the support is shown as present the recovery might continue. From the 25th of July, we’ve seen the price moving in a descending channel inside which this price is still hovering. Until we see a breakout to the upside from the channel’s resistance level we cannot say that a significant recovery began, but this might change soon if the price finds support at present levels.
If the price doesn’t find support and starts moving to the downside again the next potential target for the expected decrease would be the lower horizontal support level at $2.86.
FXOpen offers the world's most popular cryptocurrency CFDs*, including Bitcoin and Ethereum. Floating spreads, 1:2 leverage — at your service (additional fees may apply). Open your trading account now or learn more about crypto CFD trading with FXOpen.
*Important: At FXOpen UK, Cryptocurrency trading via CFDs is only available to our Professional clients. They are not available for trading by Retail clients. To find out more information about how this may affect you, please get in touch with our team.
This article represents the opinion of the Companies operating under the FXOpen brand only. It is not to be construed as an offer, solicitation, or recommendation with respect to products and services provided by the Companies operating under the FXOpen brand, nor is it to be considered financial advice.
Stay ahead of the market!
Subscribe now to our mailing list and receive the latest market news and insights delivered directly to your inbox.


Latest articles

Market Insights with Gary Thomson: Where Are Oil, Gas & Global Indices Heading?
In this video, we’ll explore the key economic events and market trends, shaping the financial landscape. Get ready for insights into financial markets to help you navigate the week ahead. Let’s dive in!
In this episode of Market

Netflix (NFLX) Shares Pull Back After a 30% Surge
On 21 January, while analysing the NFLX chart, we:
→ identified a descending channel and a resistance zone around the $100 level;
→ noted that Netflix shares were showing a sustained downtrend. Selling pressure had been triggered primarily by reports of a

US Dollar Index (DXY) Rises Above the 100 Level
Today the US Dollar Index (DXY) climbed above the psychological 100 mark for the first time in 2026, supported by a tense fundamental backdrop, with the military conflict in the Middle East acting as the main driver.
→ Financial market participants