


FXOpen
LTC/USD
Last Thursday the price of Litecoin was $39.8. From there it started falling down fast as it came from $39,75 to $32,72 at the lowest point on the same day, which is a drop of 17.5%. The price continued its downward trajectory and reached $32.5 on Friday, but the price stabilized around $32.48 level over the weekend and even started increasing on Sunday when it came up to $33.426. But more movement to the downside has been made from there as the price came down to $30.47 on Monday.
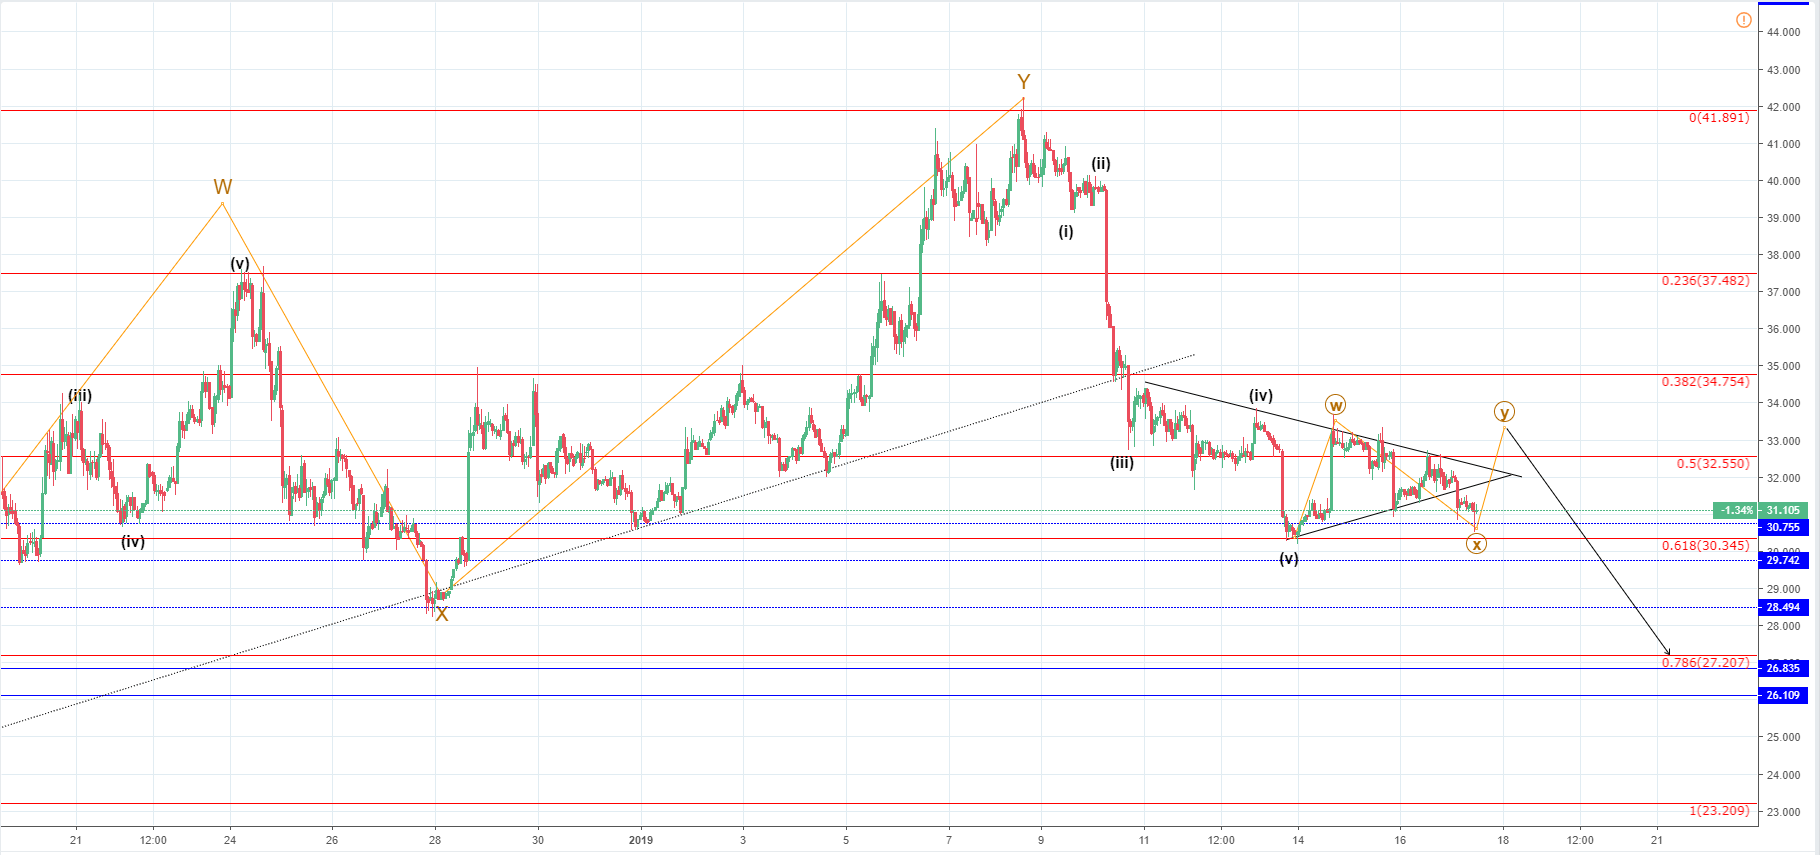
From there on the price has started increasing and came up by 9.76% as it reached $33.366 slightly above the 0.5 Fibonacci level. But since it also came to the minor downtrends resistance it started decreasing again. Hence, the sellers pushed the price back below the 0.5 Fibo level again with a struggle at first. Then the sellers showed more determination as a large 5% red candle occurred, which is only 2% lower from the previous green one to the upside.
Since then the price has attempted another breakout as a minor uptrend was established. But the momentum wasn’t strong enough for the price to break both the 0.5 Fibonacci level and the downtrends resistance as they have perfectly intersected where the price attempted to cross. Since then more movement to the downside has been seen, and a breakout from the minor uptrend support line and the price went to $30.5 but only for a few minutes, as the buyers immediately pushed the price back past the $31 level.
Looking at my Elliott Wave projection, you can see that I am expecting another increase from here followed by another downtrend. This is because my Elliott Wave count implies that the current triangle-like structure is consolidative in nature and is a correction before further downside. From this Monday the price action movement is most likely in its second stage, which if a three-wave correction will go on for another increase as the third Y wave should develop.
After the correction ends, and I don’t believe that it will go further than the ending point of the wave W or around $33.32, although it might if it gets prolonged by two more waves, we are likely going to see another move approximately the same length as like the previous one. So I have pointed at the 0.786 Fibonacci level for the price target but I would be expecting it to go further down.
EOS/USD
Since Monday when the price fell to $2.26 at it’s lowest point from the prior downtrend move, the price has started increasing with strong momentum as it came up by 11.45% to $2.52. From there as the price encountered strong resistance a retracement occurred as the price is currently sitting at $2.447.
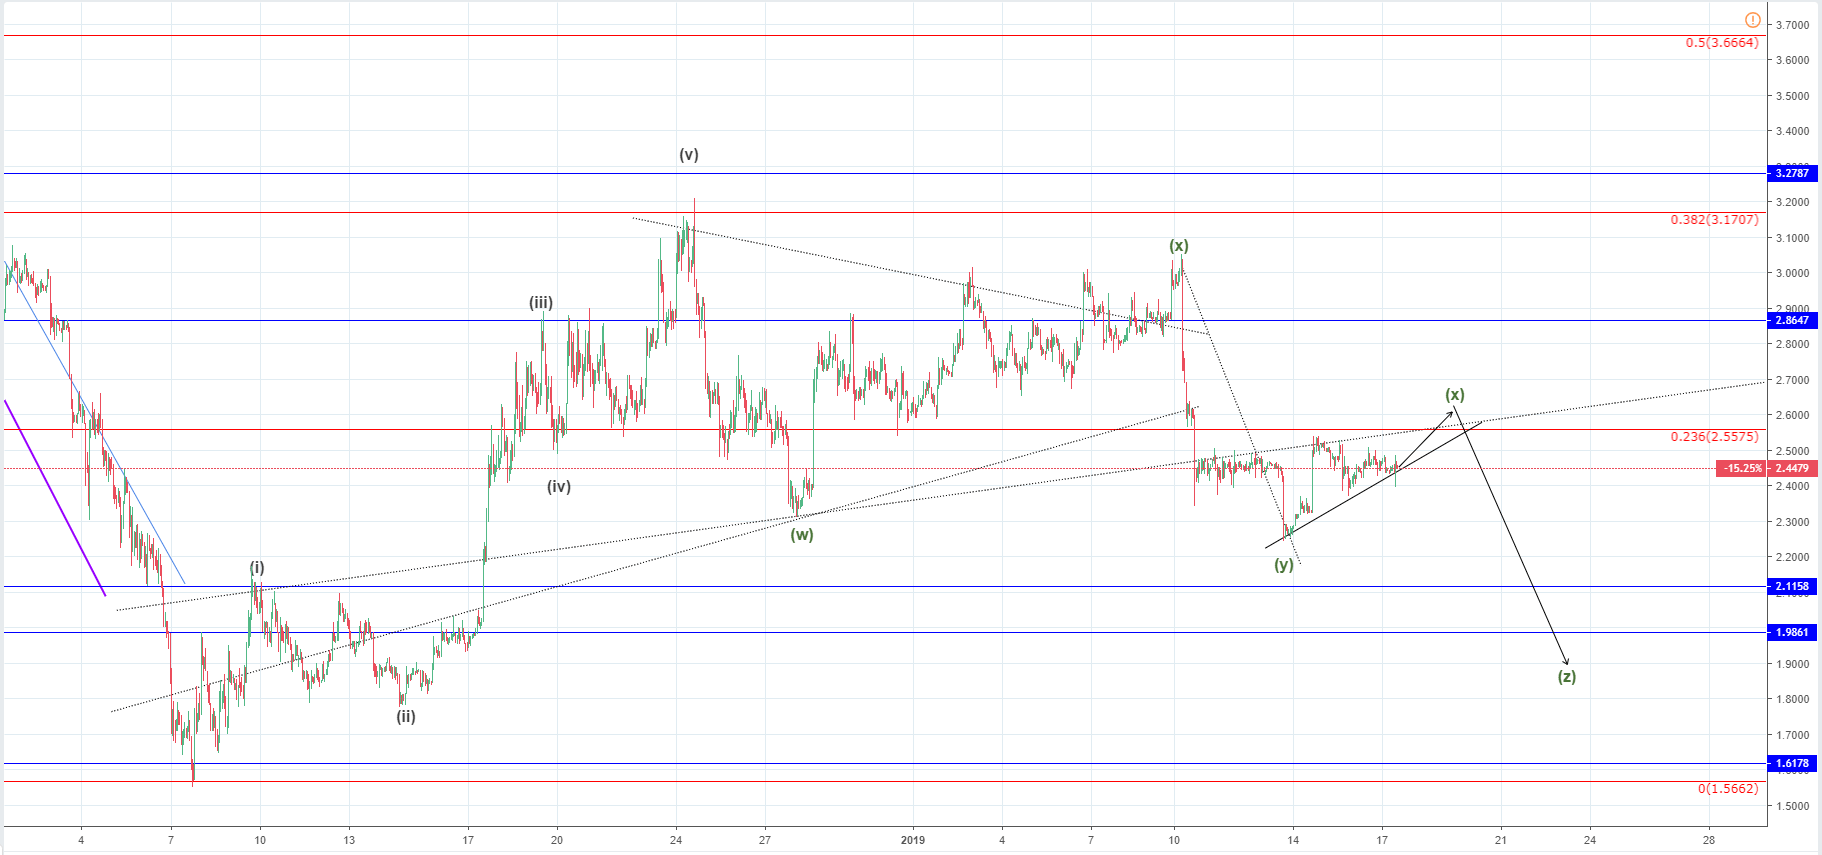
Looking at the hourly chart, you can see a similar projection like in the case of Litecoin as the market is strongly correlated. The current upward movement has formed an ascending wedge, which is most likely going to end as a breakout to the downside with further downtrend continuation as it is definitely corrective in nature. The impulsive move to the downside that we have seen last week is the third wave Y, which means that the ascending wedge structure is the 4th wave X, and is the reason why more downside should be expected as the 5th wave Z to the downside is most likely going to start after one more minor increase.
The target for the expected minor increase would be around the 0.236 Fibonacci level or at where the most significant resistance is. After it ends the wave Z should start, which will lead the price down and the first target for its ending point would be on the next horizontal support area from $2.11-$1.94.
FXOpen offers the world's most popular cryptocurrency CFDs*, including Bitcoin and Ethereum. Floating spreads, 1:2 leverage — at your service (additional fees may apply). Open your trading account now or learn more about crypto CFD trading with FXOpen.
*Important: At FXOpen UK, Cryptocurrency trading via CFDs is only available to our Professional clients. They are not available for trading by Retail clients. To find out more information about how this may affect you, please get in touch with our team.
This article represents the opinion of the Companies operating under the FXOpen brand only. It is not to be construed as an offer, solicitation, or recommendation with respect to products and services provided by the Companies operating under the FXOpen brand, nor is it to be considered financial advice.
Stay ahead of the market!
Subscribe now to our mailing list and receive the latest market news and insights delivered directly to your inbox.


Latest articles

USD/JPY and USD/CAD Continue to Rise Ahead of Key Data Releases
The US dollar continues to strengthen against major counterparts as markets await important macroeconomic data scheduled for release in the coming hours. Investors are focusing on US GDP figures, the Personal Consumption Expenditures (PCE) price index, and Canada’s labour

Oracle (ORCL) Shares Jump Above $160
Following a strong earnings report, Oracle shares surged above $160, marking roughly a 1.5-month high:
→ Earnings per share: expected $1.70, actual $1.79;
→ Revenue: expected $16.7bn, actual $17.2bn.
This is the first quarter in 15 years

USD/JPY Approaches Key Resistance Level
The USD/JPY chart shows a bullish trend at the start of March, influenced by the escalation of military activity in the Middle East.
On one hand, the US dollar is strengthening due to increased demand for safe-haven assets. On