


Market Prediction: Analysis of Potential Market Trends
FXOpen

The global market is an ever-evolving entity; thus, traders need to arm themselves with the right resources to navigate whatever changes come their way. Trends (whether up or down) are a part of the trading experience that every trader must accept. The good side, however, is that one may capitalise on any of these situations and predict market outcomes. If you want to learn how to conduct market research, meaning the usage of all available information for determining market trends, read this FXOpen article.
What Are Market Trends?
Trends are simply the overall direction of any given asset price within a given time frame. The analysis of trends is important because it provides traders with insight into predicting the financial market and making informed decisions on how and when to take a position.
It is important to note that market trend prediction differs based on a trader’s approach. For instance, a trader experienced in scalping will trade within a shorter time frame, say 5 minutes. Trend observation in this period will differ from a weekly or monthly chart.
Let’s briefly examine the types of market trends that exist.
Types of Market Trends
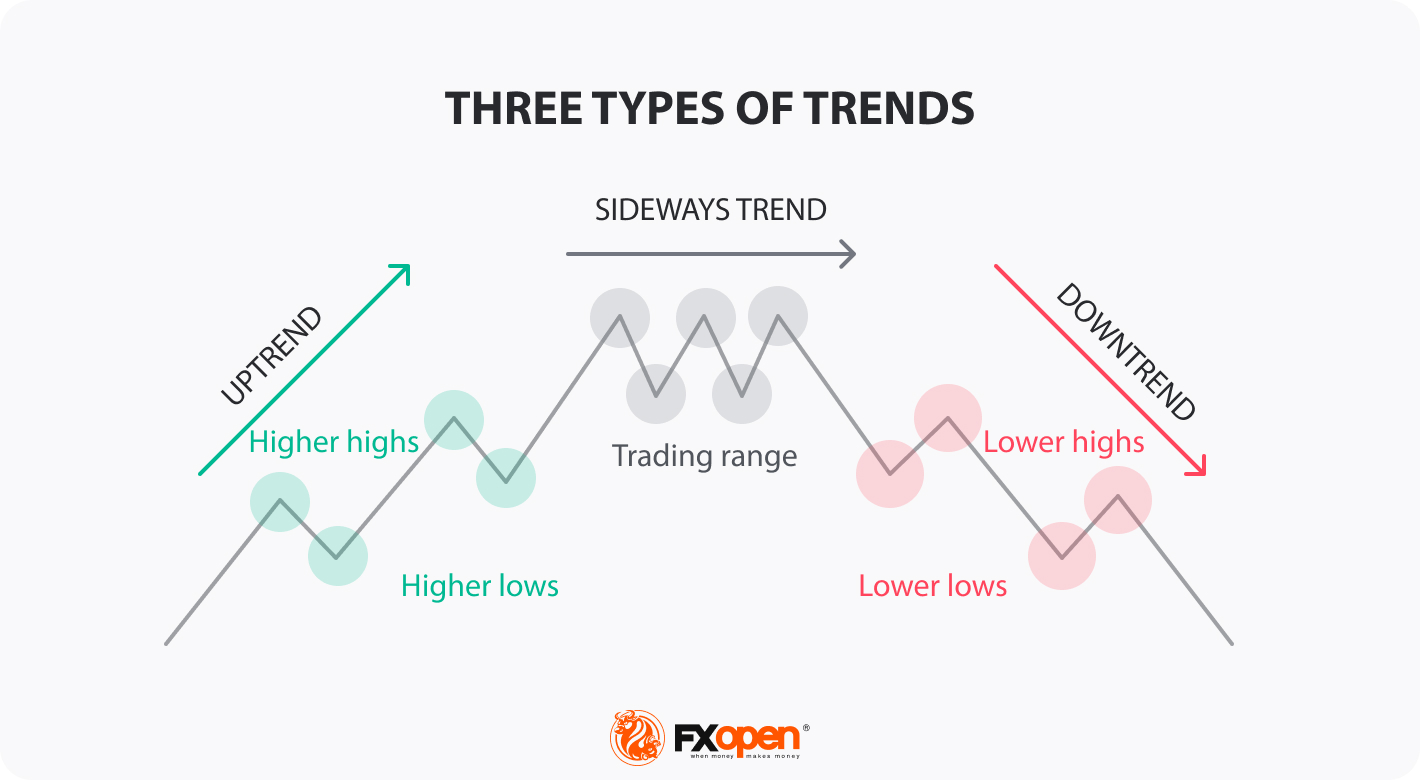
There are three types of market trends with respect to the direction of movement.
- Uptrend
- Downtrend
- Sideways
By the way, at FXOpen, you can open an account to develop your skills in identifying trends, so feel free to check it out.
Uptrend
An uptrend is a sustained upward movement of a market price that occurs when the pressure of demand exceeds that of supply. Traders often refer to this as a “bull market”, which is characterised by an optimistic feeling and confidence.
Downtrend
A downtrend is the opposite of an uptrend and refers to the downward movement of the market price over a given period when the pressure of supply exceeds that of demand. It is formed by declining prices and is often referred to by traders as a bear market. In contrast to the uptrend, downtrends usually spread pessimism, anxiety, and fear of loss.
Sideways Trend
The sideways trend happens when the price oscillates narrowly between support and resistance levels due to the indecisiveness of buyers and sellers. During this period, the market tends to lack a clear direction, moving back and forth between support and resistance levels.
How to Conduct Market Analysis
There are many ways to conduct market analysis. The most popular ones are:
Fundamental Analysis
Fundamental analysis is a popular approach to analysing market trends. It involves evaluating the intrinsic value of an asset by examining the various fundamental factors that can impact its price. This type of analysis is particularly important for long-term traders who want to understand the intrinsic value of an asset. Types of fundamental analysis include:
1. Quantitative Fundamental Analysis.
Quantitative analysis involves the use of numerical data and financial metrics to evaluate an investment. In the stock market, it focuses on the quantitative aspects of a company's financial performance and the potential for financial growth. Quantitative analysis in forex involves the use of numerical data and economic indicators to assess the strength and potential direction of a currency pair.
2. Qualitative Fundamental Analysis:
Qualitative analysis focuses on non-quantifiable aspects of an investment, such as the company's management, industry position, competitive advantages, and external factors that could affect its prospects. Qualitative analysis in forex involves considering non-numerical factors that can influence currency values, including geopolitical events, market speculation, and global economic conditions.
Elliott Wave Analysis
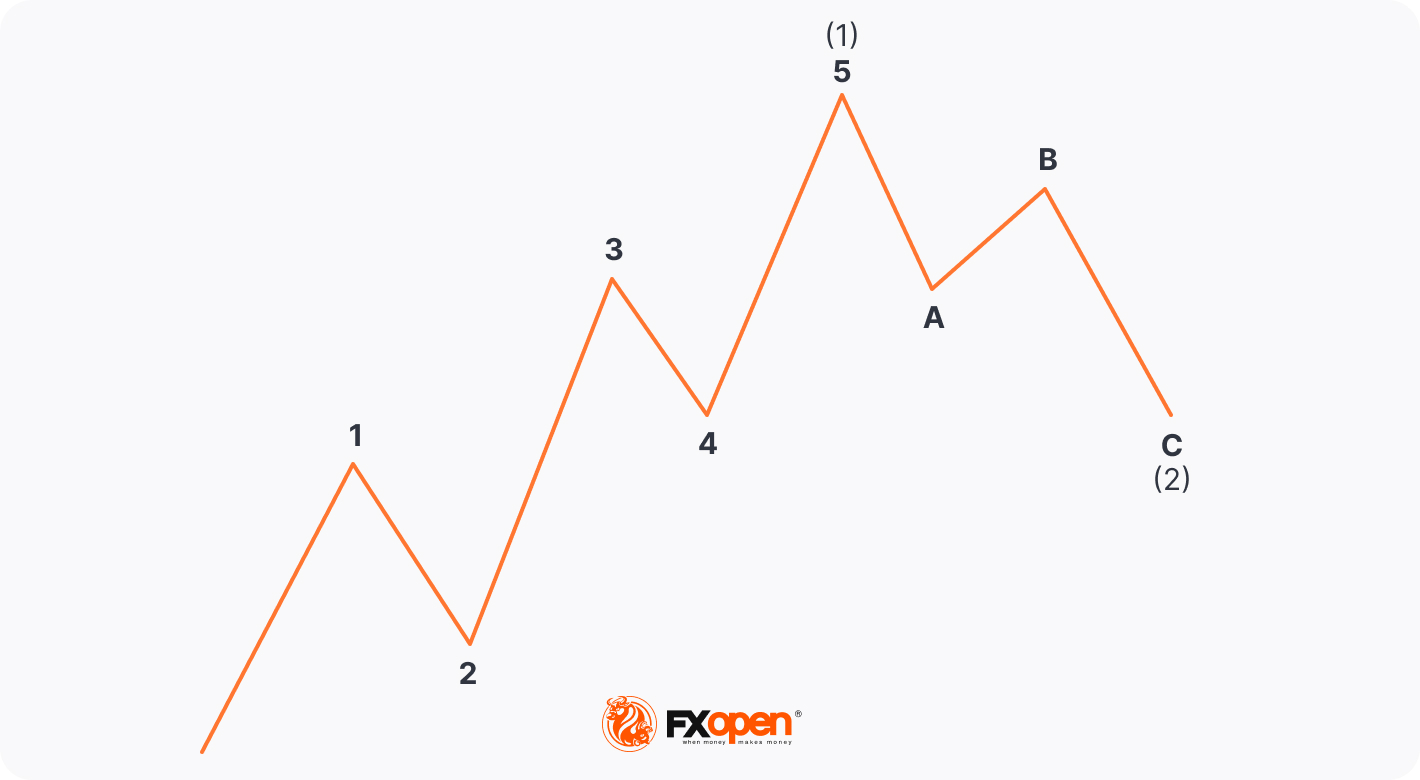
Elliott Wave analysis is a popular technical analysis method used by traders to analyse and predict price movements in financial markets, particularly in stocks, forex, and commodities. It's based on the idea that markets move in repetitive patterns. The theory is based on a series of wave patterns that follow specific rules and guidelines.
Elliott Waves can be classified as:
1. Impulse Waves
These are five-wave patterns that move in the direction of the prevailing trend. Impulse waves consist of three upward waves (called "impulse waves") and two downward correction waves (called "corrective waves").
2. Corrective Waves
These are three-wave patterns that move against the direction of the prevailing trend. Corrective waves serve to balance out the price movement after an impulse wave.
The Dow Theory
The Dow Theory is a method used to analyse and predict market trends. It was developed by Charles H. Dow, one of the founders of Dow Jones & Company and creator of the Dow Jones Industrial Average (DJIA). These are the major principles the theory is based on:
1. The Market Discounts Everything
This principle states that all available information, whether public or private, is already reflected in the current market price. Therefore, the theory focuses on analysing price movements to make price predictions.
2. The Market Has Three Phases
According to Dow Theory, the market's price movements are categorised into three phases:
Primary Trend: The main long-term direction of the market, which can be bullish (upward), bearish (downward), or sideways (range-bound).
Secondary Trend: A shorter-term, counter-trend movement that retraces a portion of the primary trend. These reactions are often caused by news events or short-term fluctuations.
Minor Trend: Short-term price movements within the secondary trend. Dow Theory primarily focuses on the primary and secondary trends.
3. Stock Averages Must Confirm
For a trend to be considered valid, both the Dow Jones Industrial Average (representing industrial stocks) and the Dow Jones Transportation Average (representing transportation stocks) must move in the same direction. If one average makes a significant move without confirmation from the other, it can signal a potential reversal.
Fibonacci Levels
Fibonacci levels are widely used in financial analysis as a tool for studying market trends. There are Fibonacci retracements and extensions. These are technical analysis tools used by traders and analysts to identify potential support and resistance levels in financial markets. These tools are based on the Fibonacci sequence and ratios, which have been observed to occur in natural phenomena and, when applied to price charts, can help traders make informed decisions about entry and exit points.
1. Fibonacci Retracements
Fibonacci retracements are used to identify potential levels of support or resistance in a price trend. They are based on the idea that after a significant price move, prices often retrace or pull back to certain key Fibonacci levels before resuming their trend. The most common retracement levels are as follows:
- 0.236 (23.6%)
- 0.382 (38.2%)
- 0.500 (50.0%)
- 0.618 (61.8%)
- 0.786 (78.6%)
These lines indicate potential support or resistance levels where the price may pause or reverse.
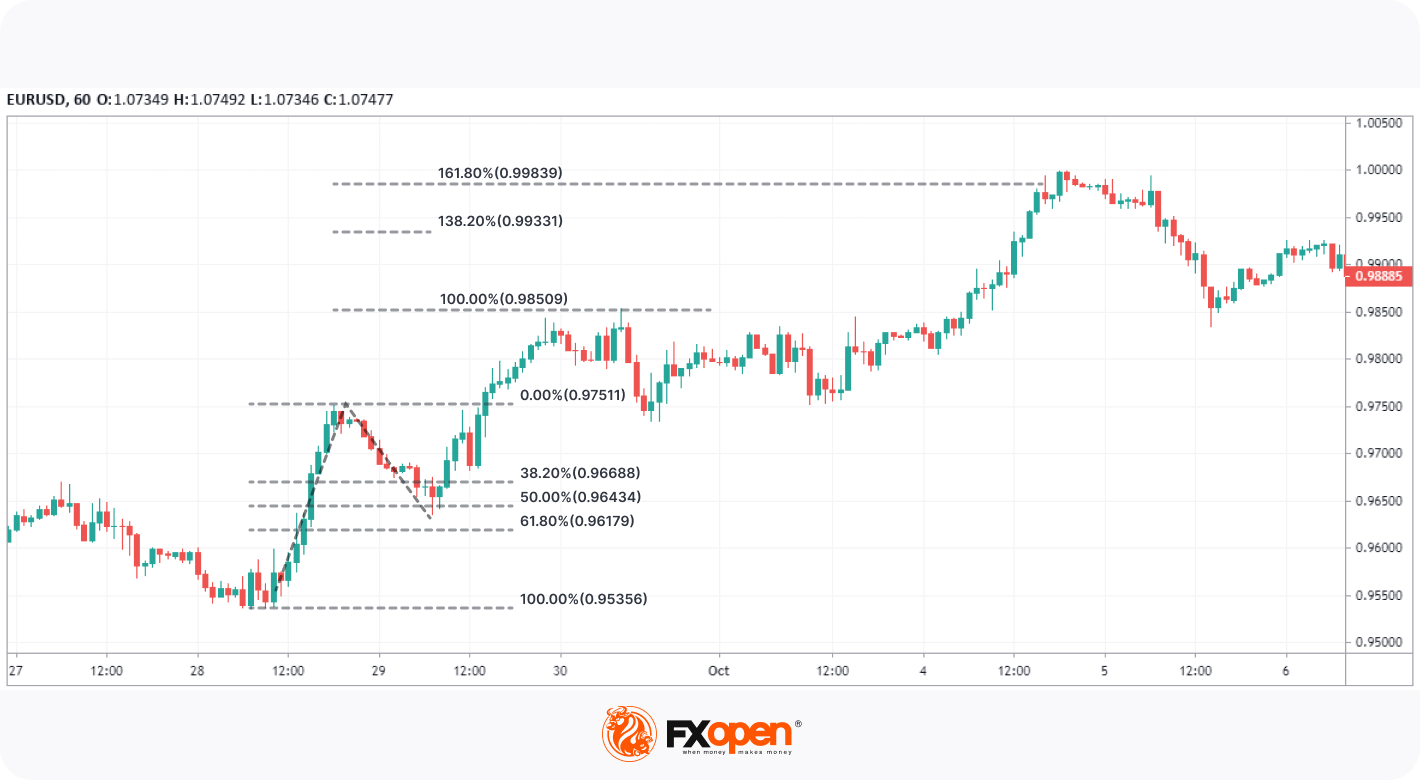
2. Fibonacci Extensions
Fibonacci extensions, also known as expansion or projection levels, are used to identify potential price targets beyond the most recent high or low in a price trend. They are particularly useful for traders looking to set profit targets or identify where a trend may potentially end. The most common extension levels include:
- 0.618 (61.8%)
- 1.000 (100.0%)
- 1.272 (127.2%)
- 1.618 (161.8%)
- 2.618 (261.8%)
If you want to learn how to use Fibonacci levels, you can use our free TickTrader platform to perform comprehensive market analysis.
Wyckoff Method
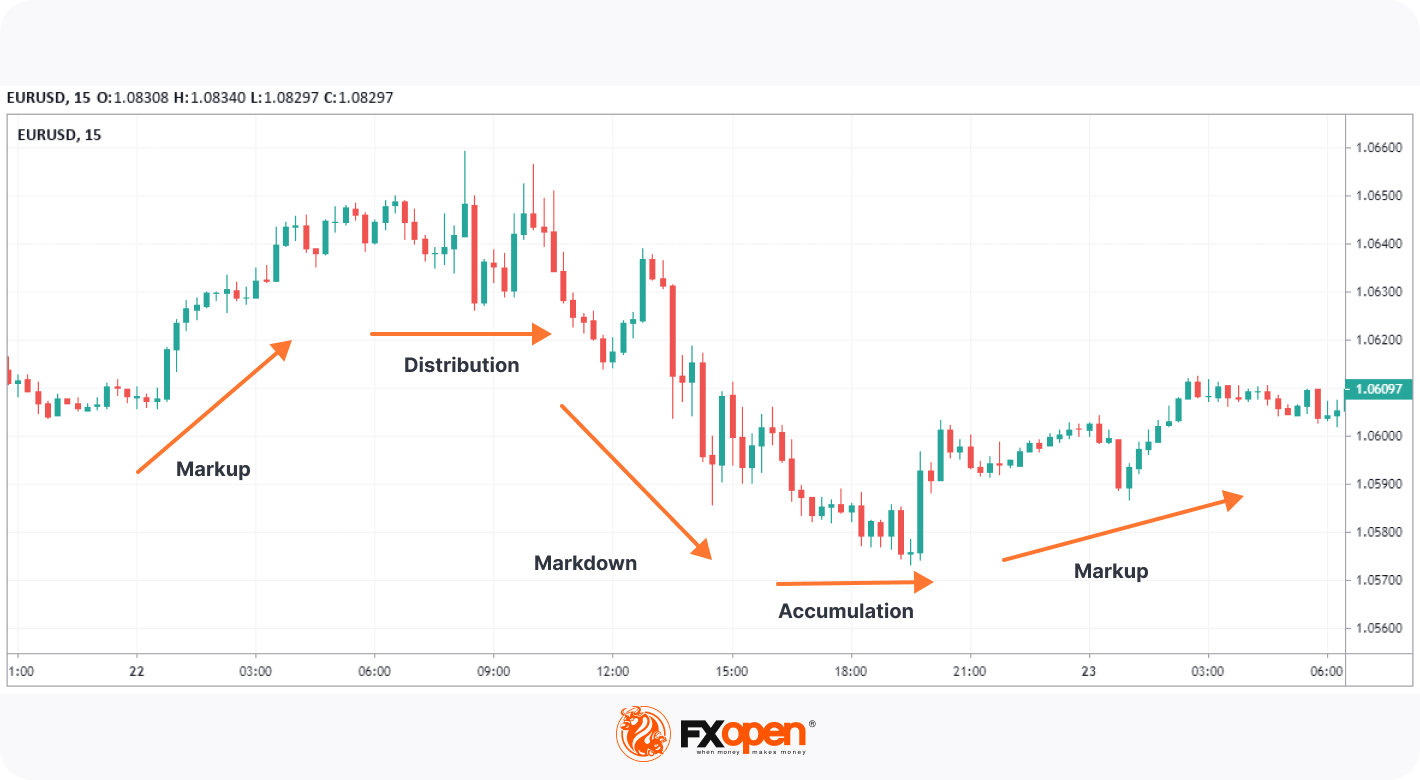
The Wyckoff method is a popular tool for market trend analysis that focuses on understanding the actions of large traders or institutions to predict future price movements. Developed by Richard Wyckoff in the early 20th century, this method emphasises studying the overall market structure, supply, and demand dynamics. Two key components of the Wyckoff method include:
Accumulation and Distribution: Wyckoff believed that large institutions, often referred to as "smart money," accumulate and distribute positions in the market over time. This accumulation and distribution process can be observed in price and volume patterns on charts.
Phases of the Market: The Wyckoff Method categorises the market into different phases, including Accumulation, Markup (Uptrend), Distribution, and Markdown (Downtrend). Recognising these phases helps traders anticipate future price movements.
Wyckoff Technique: This technique involves analysing price charts, identifying specific patterns, and using Wyckoff's principles to make trading decisions. Traders often look for chart patterns like Wyckoff Springs (potential reversal points) and Wyckoff Upthrusts (potential false breakouts).
Final Thoughts
After a thorough analysis of potential market trends, it is clear that careful consideration and strategic decision-making are crucial for success in this dynamic environment. As market conditions continue to evolve, it is essential to stay informed and adapt to emerging opportunities. You can read more about markets in our blog.
This article represents the opinion of the Companies operating under the FXOpen brand only. It is not to be construed as an offer, solicitation, or recommendation with respect to products and services provided by the Companies operating under the FXOpen brand, nor is it to be considered financial advice.
Stay ahead of the market!
Subscribe now to our mailing list and receive the latest market news and insights delivered directly to your inbox.


Latest articles

US Dollar Index: A Defining Week for the King of the Markets
The dollar heads into a pivotal week trading near 101.80, just off a 15-month high, with the Fed's July 29 meeting standing as the clear focal point. Markets currently price roughly a 65% chance of a hold, though renewed

NZD/USD: Inflation Surge Meets Strong US Dollar Pressure
On 21 July, Stats NZ reported an acceleration in inflation: the Consumer Price Index rose 1.5% in the second quarter, while the annual inflation rate climbed to 4.1%, its highest level in more than two years and slightly

Weekly Market Insights with Gary Thomson: The Week of Central Banks and Earnings
In this video, we’ll explore the key economic events and market trends, shaping the financial landscape. Get ready for insights into financial markets to help you navigate the week ahead. Let’s dive in!
In this episode of Market