


Mass Index Indicator: Definition, Calculation, and Trading Strategies
FXOpen
Developed by Donald Dorsey, the mass index indicator can be a good tool in a trader’s arsenal. The indicator has been widely favoured due to its effectiveness in predicting market reversals and identifying critical turning points.
In this article, we will thoroughly explore the mass index and its application in trading strategies and highlight common pitfalls to avoid. By understanding the calculation and interpreting the signals generated by the mass index, FXOpen traders can gain valuable insights into market conditions.
What Is a Mass Index Indicator?
The mass index trading indicator is a technical analysis tool that helps traders identify potential reversals in price trends. It is known for its ability to measure volatility and changes in price range over a specific period. The mass index value is built by analysing the range between high and low prices over a defined timeframe. When the price range widens significantly, indicating increased volatility, the mass index rises. Conversely, when the range narrows, suggesting decreased volatility, the mass index falls.
Calculation of the Mass Index Indicator
The mass index indicator formula was developed by Donald Dorsey in the early 1990s. To calculate the indicator, you need to follow these steps:
- It starts by calculating a single EMA, which is a 9-period EMA of the difference between the high and low prices.
- Next, a double EMA is calculated, which represents a 9-period EMA of the 9-period EMA of the high-low differential.
- The EMA ratio is obtained by dividing the single EMA by the double EMA.
- Finally, the mass index is determined by summing the EMA ratios over a 25 period.
Interpreting Mass Index Signals and Trading Strategies
The mass index technical indicator offers two primary signals: reversal bulges and divergences.
Reversal Bulges
A reversal bulge occurs when the indicator rises above a certain threshold, indicating an impending trend reversal. Donald Dorsey, the creator of the mass index, identified two critical values: 27 and 26.5, which he considered significant in detecting potential reversals. According to Dorsey's hypothesis, a reversal bulge occurs when the mass index rises above 27 and subsequently drops below 26.5. This particular pattern indicates a potential trend reversal. Traders may consider opening a trade in the opposite direction of the prevailing trend when they spot a reversal bulge.
Traders may place a stop loss below/above the recent swing low/high, enter the trade when the reversal bulge occurs, and set a take profit at a predetermined resistance/support level.
To increase the number of signals generated by the reversal bulge, chartists have the flexibility to lower the threshold. This approach recognises that different levels of volatility require tailored strategies. Hence, chartists may need to analyse Mass Index levels over a period of time to determine historical highs and lows. A movement that approaches the upper range of historical values indicates a volatility bulge, which may potentially signal an upcoming reversal in the market.
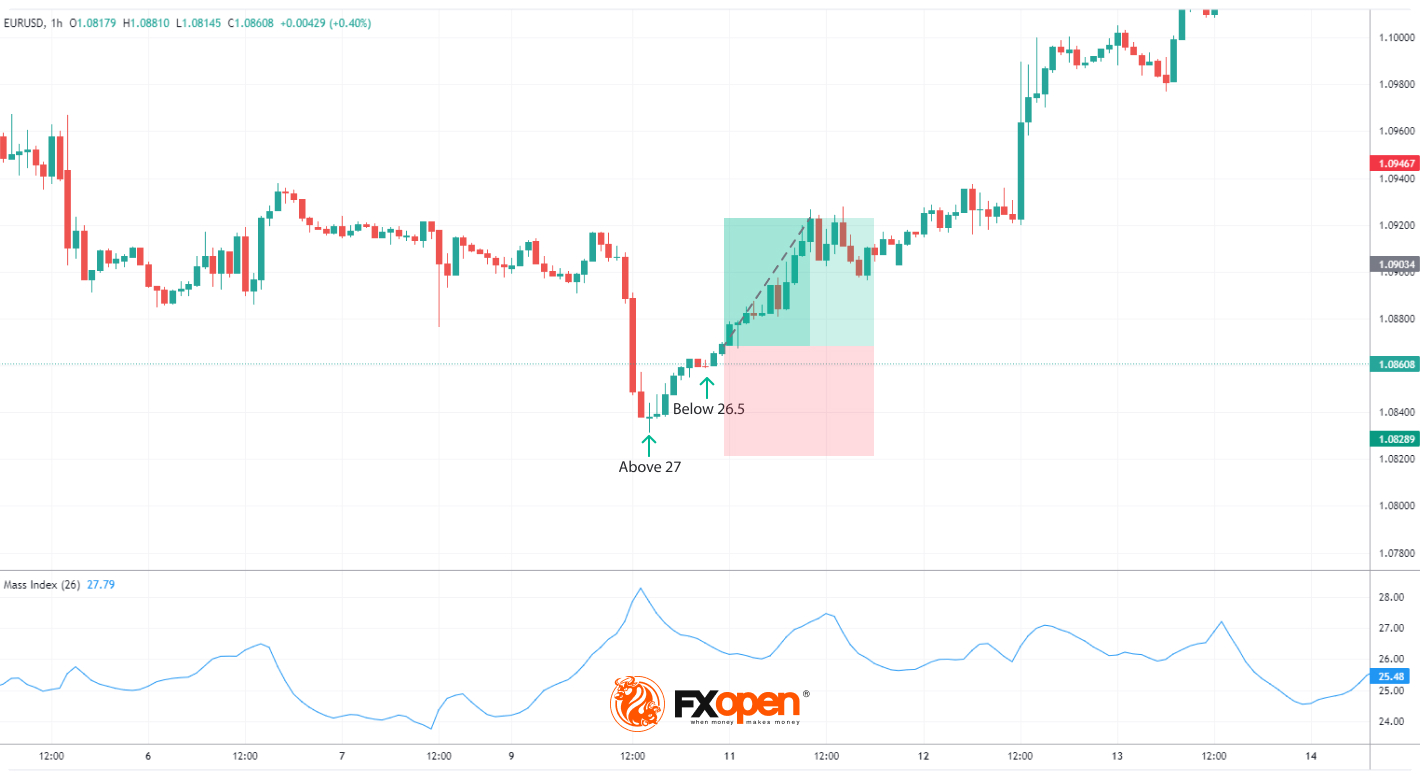
In the EURUSD chart above, a trader enters a long position on a reversal when the mass index reaches a value greater than 27 and then drops below 26.5. Indicating a potential trend reversal, the trader enters the market with a long position on the upcoming bullish candles. They place a stop loss below the swing low with a take profit at the next resistance.
Divergence
A divergence happens when the price trend and the indicator move in opposite directions. A bullish divergence occurs when the price makes lower lows while the mass index makes higher lows, indicating a potential trend reversal to the upside. Conversely, a bearish divergence occurs when the price makes higher highs while the oscillator makes lower highs, suggesting a potential trend reversal to the downside.
Traders may enter a long/short trade when the price shows signs of reversal confirmation, such as subsequent bullish/bearish candles or a breakout above a previous high/low. You may set a stop-loss order below/above the recent swing low/high and aim for a take-profit target near a resistance/support level or a previous swing high/low.
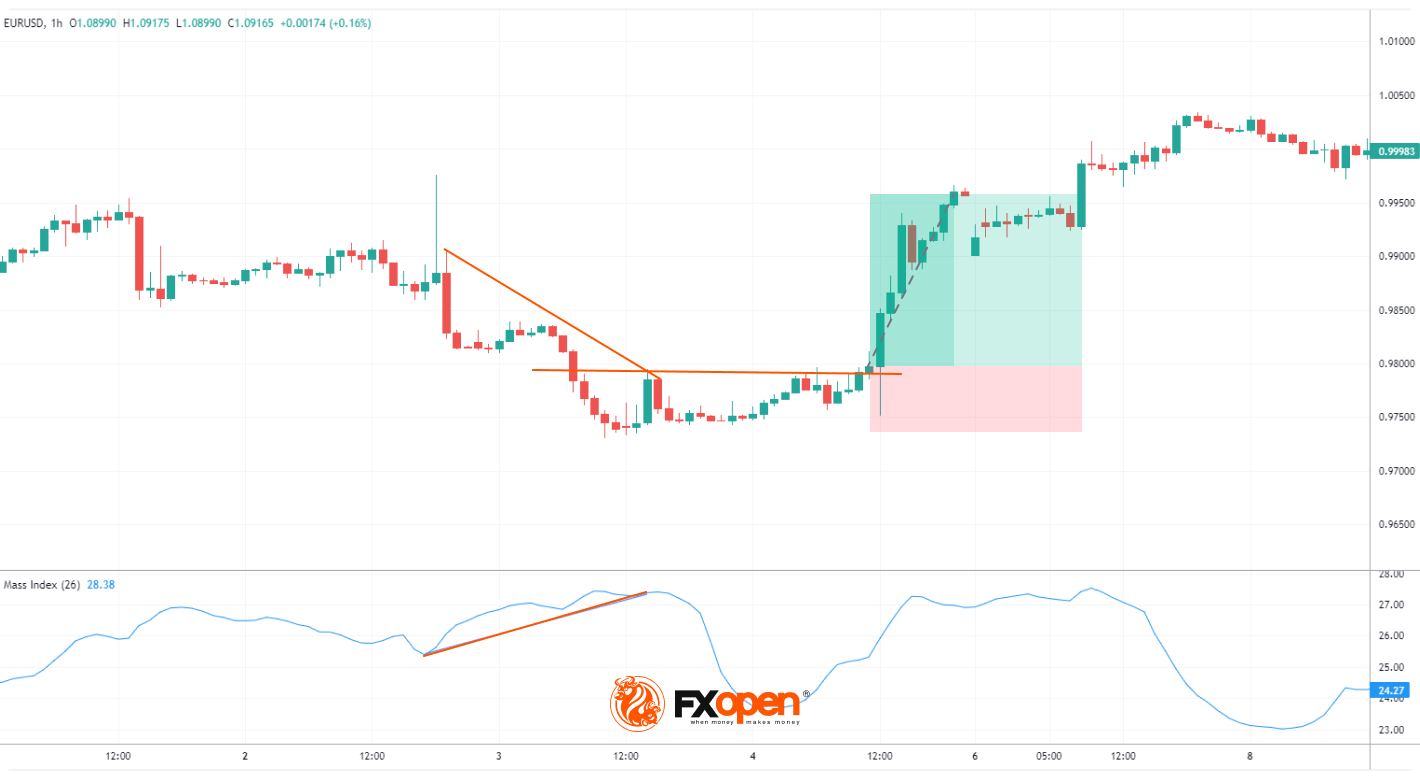
A trader finds a bullish divergence in the EURUSD chart. They enter a trade when subsequent green candles form and a small breakout above the lower high is observed. The trader places a stop loss below the swing low. Their take profit is at the next resistance level.
Limitations of the Mass Index
While the mass index indicator on a chart can be a valuable tool, it's important to consider its limitations. Here are a few key points market participants may note:
- The indicator is not infallible. Traders use it with other technical analysis tools to increase the accuracy of trading signals. False signals can occur, especially during periods of low volatility or when the market moves in a strong trend.
- The technical tool may lag behind rapidly changing market conditions, potentially causing missed opportunities or delayed entry/exit points.
To utilise the indicator, traders can open an FXOpen account and access a robust trading platform with low spreads on various financial instruments.
Conclusion
While the mass index indicator on stock, forex, and other financial instruments may provide insights into potential trading opportunities, it's important to note that it’s not foolproof. As mentioned above, traders exercise caution and consider using the indicator in conjunction with other technical indicators available on platforms like TickTrader or analysis techniques to increase the reliability of their trading decisions. Also, risk management practices may be employed to mitigate potential losses.
This article represents the opinion of the Companies operating under the FXOpen brand only. It is not to be construed as an offer, solicitation, or recommendation with respect to products and services provided by the Companies operating under the FXOpen brand, nor is it to be considered financial advice.
Stay ahead of the market!
Subscribe now to our mailing list and receive the latest market news and insights delivered directly to your inbox.


Latest articles

EUR/USD Eyes Gains As USD/CHF Weakness Deepens Again
EUR/USD started a fresh increase above 1.1700 and 1.1720. USD/CHF declined further and is now struggling below 0.7835.
Important Takeaways for EUR/USD and USD/CHF Analysis Today
· The Euro started a decent increase from

Apple: Earnings Day Above the Activity Zone
On 30 April, after the market close, Apple Inc. will release its financial results for the second quarter of fiscal 2026. The consensus forecast, based on estimates from 31 analysts, points to revenue of around $109.7 billion, with expected

USD/JPY and USD/CHF Near Key Levels: The Dollar Supported by the Fed
The US dollar continues to trend upwards following the Federal Reserve meeting, drawing support from the regulator’s moderately hawkish stance and comments by Jerome Powell. Markets interpret the Fed’s rhetoric as a signal that restrictive policy is likely