


Money Flow Index Trading Strategies
FXOpen

The Money Flow Index is a popular tool in trading, measuring both price and volume. This article delves into the core principles of the MFI, provides actionable trading strategies, and offers best practices to maximise your trading effectiveness.
Money Flow Index Explained
The MFI, or Money Flow Index, is a momentum indicator that plays a crucial role in technical analysis. Developed to evaluate the intensity of money flowing into and out of a financial instrument, the MFI oscillates between 0 and 100. Generally calculated over 14 periods, it incorporates both price and volume data to present a more comprehensive view of market conditions.
The basic interpretation of MFI revolves around identifying overbought and oversold states. A reading above 80 typically suggests that an asset may be overbought, meaning it could be ripe for a price pullback. Conversely, an MFI value below 20 often signals an oversold condition, suggesting a potential upward reversal in price.
Moreover, sustained MFI readings above or below the midpoint of 50 can provide further clues about market sentiment. If the MFI consistently stays above 50 for an extended period, it may indicate underlying bullish sentiment and vice versa.
For the best understanding of the strategies below, consider using FXOpen’s free TickTrader platform. There, you’ll find the MFI and each indicator discussed waiting to be used.
MFI Divergence
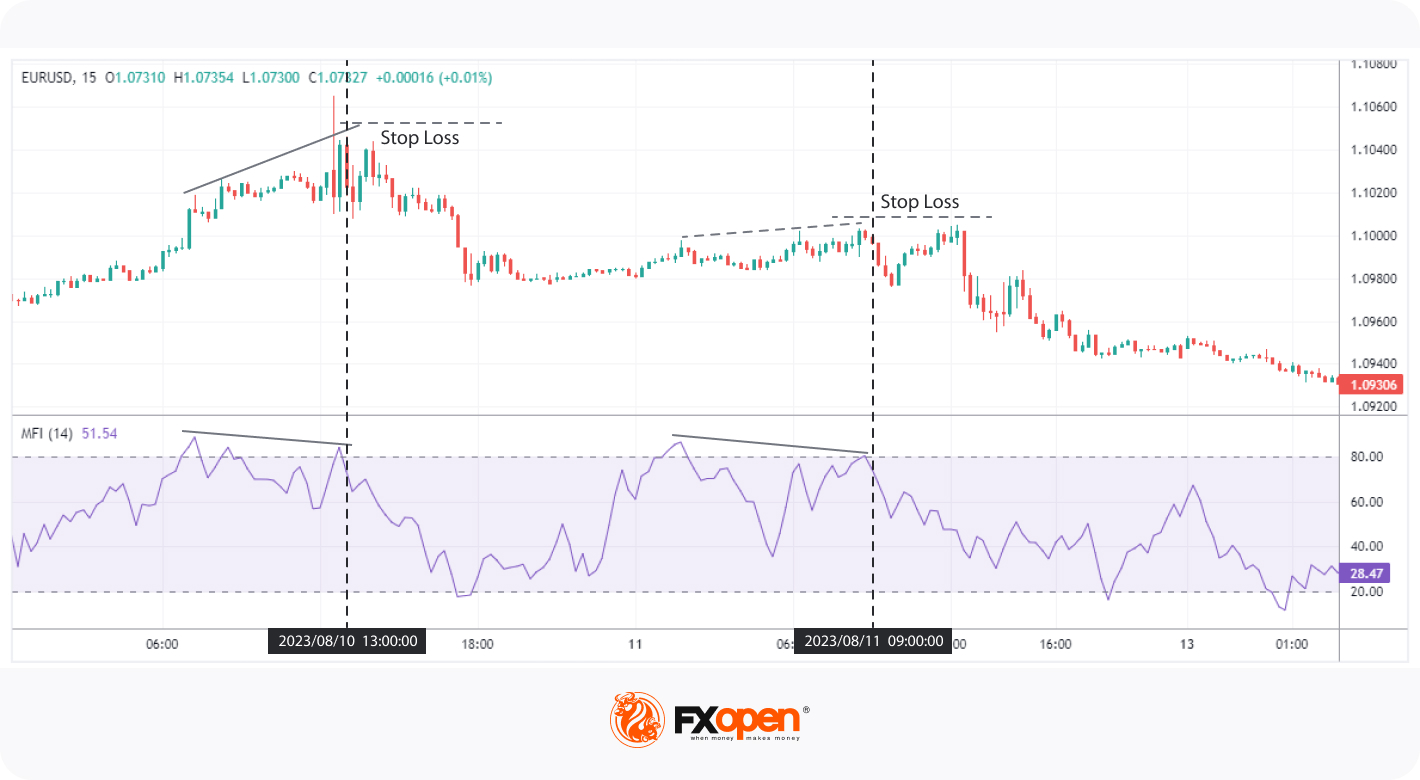
Divergences between asset prices and the MFI frequently precede reversals. When the MFI diverges from the asset's price but then crosses back above 20 or below 80, it often suggests that the divergence may result in a shift in market direction. These criteria can be useful for confirming entry points in a divergence strategy.
Divergence occurs when there's a disconnect between the asset's price and the MFI, often hinting at a potential reversal in price. Traders often view these divergences as reliable signs of an impending shift in market momentum.
Entry
- In the case of bullish divergence, traders often identify when the asset forms a new low while the MFI forms a higher low. A common practice is to go long when the MFI crosses back above 20.
- For bearish divergence, it's common to observe when the asset forms a new high while the MFI registers a lower high. Traders often go short when the MFI crosses back below 80.
Stop Loss
- With bullish divergence, a stop loss is often set just below the recent low where the divergence was spotted.
- When identifying bearish divergence, traders frequently set a stop loss just above the recent high where the divergence was identified.
Take Profit
- In a bullish divergence scenario, traders often target resistance levels or pivot points to take profit.
- For bearish divergence, support levels or pivot points are commonly used as profit targets.
While not foolproof, this approach is often considered a valuable part of a trader's toolkit, especially when used alongside other forms of market analysis.
MFI Trend Following
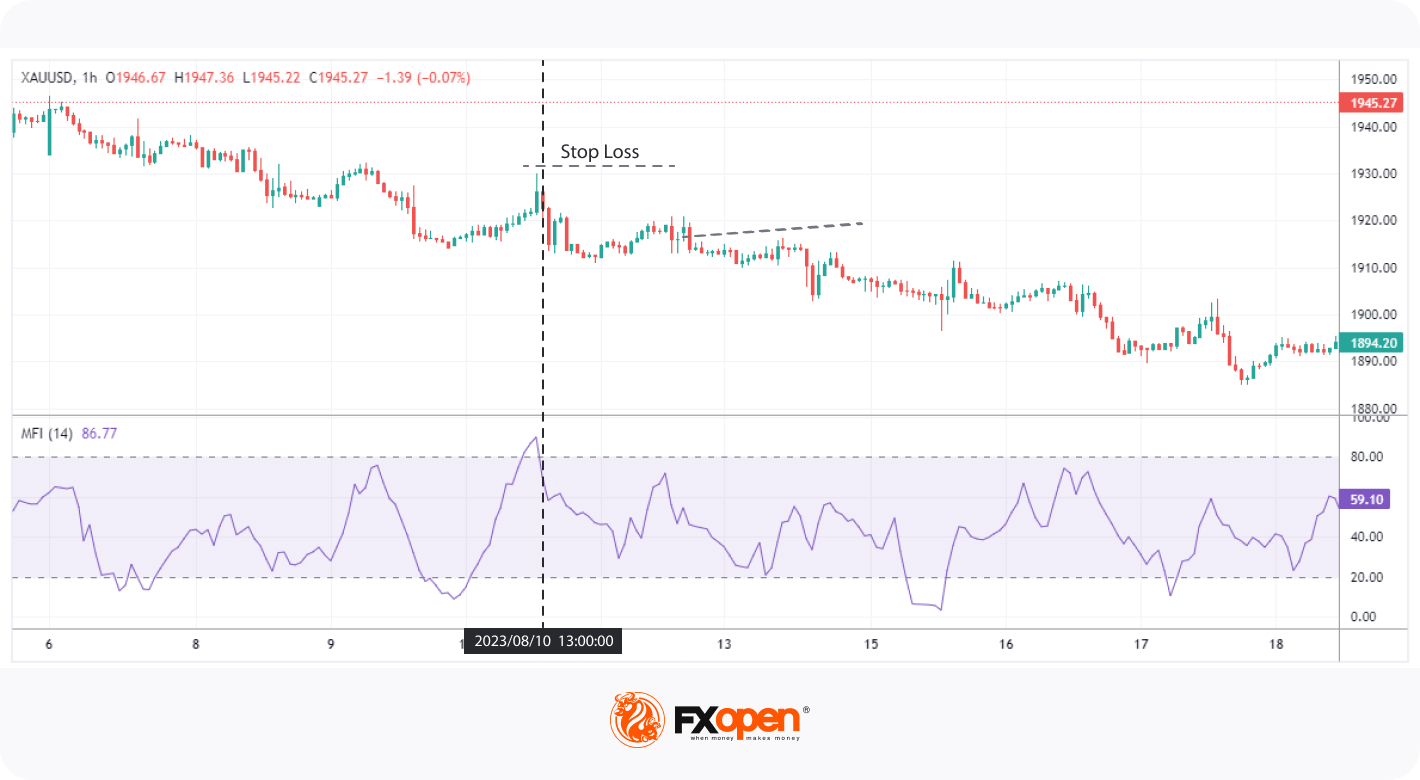
The MFI Trend Following strategy aims to capture substantial moves within existing trends. Specifically, traders look to participate in trends by entering during significant pullbacks, as indicated by the MFI.
The strategy aims to capitalise on significant pullbacks within existing trends rather than confirming the trend's overall direction. When the MFI moves into oversold or overbought territories and then reverses to cross back above 20 or below 80, it provides an opportunity to enter or re-enter a trending market at a potentially advantageous price.
Entry
- During an established uptrend, traders typically watch for the MFI to dip below 20, signalling a temporary oversold condition. You may choose to go long when the MFI crosses back above 20.
- Conversely, in a confirmed downtrend, if the MFI climbs above 80, it indicates a temporary overbought state. You can enter a short position when the MFI crosses back below 80.
Stop Loss
- In an uptrend, a stop loss is generally set below the recent swing low where the MFI signalled oversold.
- For a downtrend, a stop loss might be placed above the latest swing high where the MFI indicated overbought conditions.
Take Profit
- If in an uptrend, profit targets are often set at upcoming resistance levels.
- Alternatively, in a downtrend, support levels serve as typical targets for taking profit.
MFI and Bollinger Bands
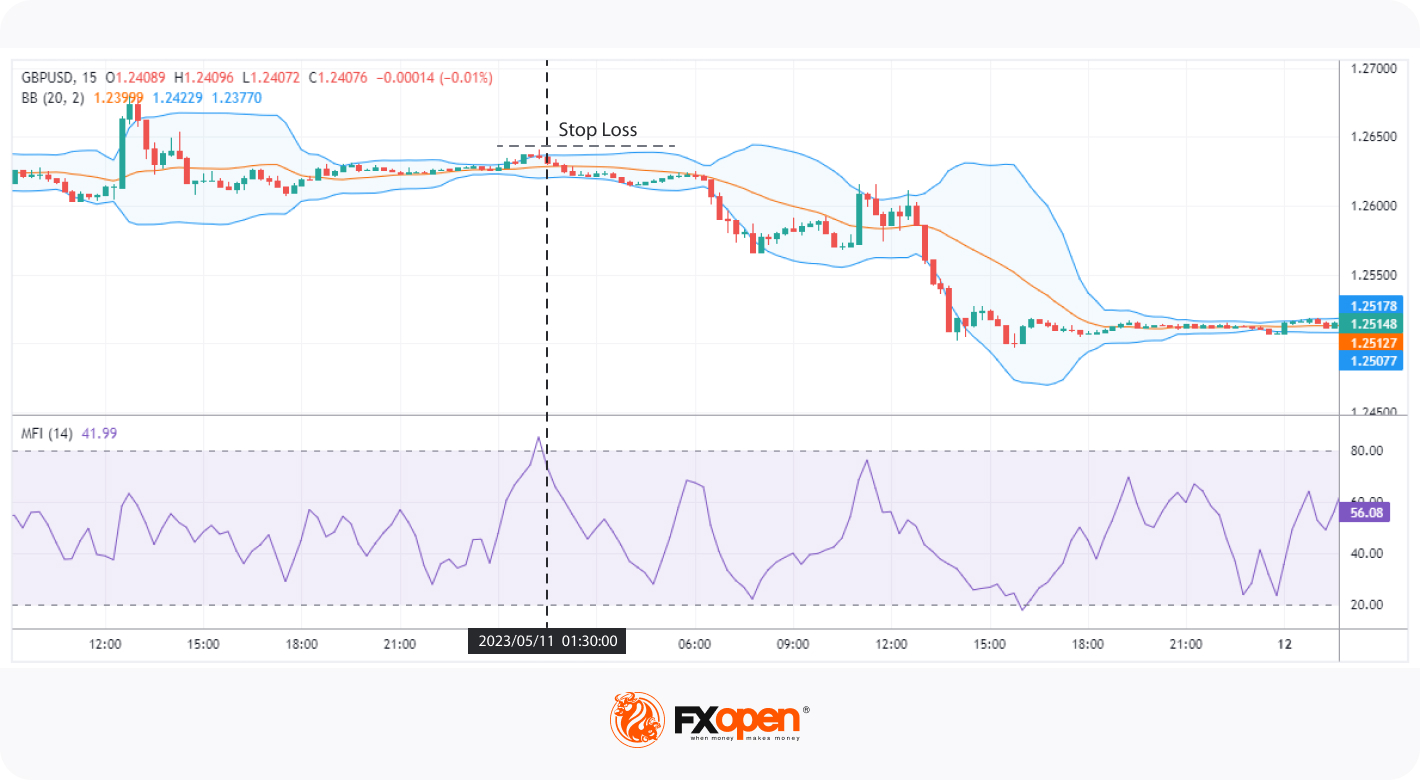
The MFI and Bollinger Bands strategy merges the momentum-focused MFI with the volatility-measuring Bollinger Bands to identify trading opportunities. Bollinger Bands consist of a middle band (a simple moving average) with two outer bands calculated at standard deviations away from the middle band. By combining these indicators, traders aim to capture price swings during varying volatility levels.
The underlying principle of this strategy is that price reversals are often witnessed when the asset's price touches the upper or lower Bollinger Band. Incorporating MFI adds an extra layer of validation, offering a more holistic view of both momentum and volatility. This synergy enhances the probability of capturing a meaningful price reversal, making the setup more robust.
Entry
- When the MFI dips below 20, and the price touches the lower Bollinger Band, entering a long position as the MFI crosses back above 20 is an option.
- On the flip side, if the MFI exceeds 80 and the price taps the upper Bollinger Band, initiating a short position as the MFI crosses back below 80 is a consideration.
Stop Loss
- For long entries, a stop loss might be set just below the lower Bollinger Band.
- For short entries, a stop loss could be placed just above the upper Bollinger Band.
Take Profit
- With long positions, traders frequently target near the upper Bollinger Band to take profit.
- For short positions, profit aims are often near the lower Bollinger Band.
Best Money Flow Indicator Strategy Practices
When deploying MFI-based trading strategies, you may want to consider a few best practices that can increase the likelihood of success. Here are some suggestions tailored to the strategies discussed:
- Using Multi-Timeframe Analysis: Analysing multiple timeframes can offer more context, especially when identifying divergences or trends.
- Combining with Price Action: Looking for candlestick patterns that confirm MFI signals may increase the effectiveness of strategies, particularly when utilising the Bollinger Bands approach.
- Risk Management: Be strict about setting stop losses and take-profit levels as outlined in each strategy to protect against sudden market reversals.
- Backtest: Before employing any MFI strategy, backtesting is crucial to gauge its efficacy in various market conditions.
The Bottom Line
In conclusion, understanding and effectively utilising the Money Flow Index indicator can greatly enhance your trading strategies. Whether you're looking to spot divergences, follow trends, or combine it with Bollinger Bands, mastering MFI can offer valuable insights into market conditions. To put these strategies into practice and explore the full potential of MFI, consider opening an FXOpen account today.
This article represents the opinion of the Companies operating under the FXOpen brand only. It is not to be construed as an offer, solicitation, or recommendation with respect to products and services provided by the Companies operating under the FXOpen brand, nor is it to be considered financial advice.
Stay ahead of the market!
Subscribe now to our mailing list and receive the latest market news and insights delivered directly to your inbox.


Latest articles

Nasdaq 100: 48 Hours of Chaos, One Trendline Standing in the Way
Wall Street just lived through one of its wildest 48 hours of the year. On Wednesday, the Fed held rates steady at 3.50%-3.75%, but three FOMC members broke ranks to demand a hike—an unusually hawkish dissent

Amazon Analysis: Strong Earnings Coincide with a Breakout from the Correction
On 30 July, Amazon.com reported its financial results for the second quarter of 2026, significantly exceeding market expectations. Revenue rose 20% year-on-year to $200.6 billion, compared with the consensus forecast of around $196.5 billion. The main growth

GBP/USD and EUR/GBP Await Key Bank of England Decision
The pound strengthened following the outcome of the US Federal Reserve meeting, where the central bank, as expected, kept interest rates unchanged. However, the Fed did not provide the market with clear signals of an imminent shift towards rate cuts,