


Namecoin, Peercoin Add to Gains
FXOpen

Both Namecoin and Peercoin have continued their rallies and are now quoted above 80 cents per coin. We’ll start with PPC/USD and get back to Namecoin later in the article.
Peercoin Rallies by 41 Percent
Peercoin prices rallied by over 41 percent compared to two weeks ago. We are currently quoted at $0.851, 24 cents above the $0.611 price noted in our previous PPC article.
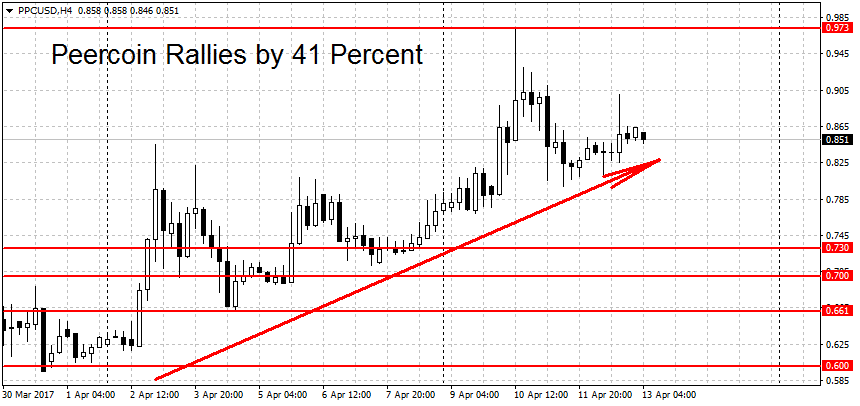
No Peercoin specific news has been released during this time period. The general climate of gains in the crypto market and especially in BTC and LTC seems to be the reason for this pump. With no reason behind the move its hard to add anything about whether the rally will continue from a fundamental perspective.
Technically the uptrend is still in place. To end it, the bears will have to push PPC/USD below the $0.661 swing low. A move further down below the $0.50 round figure would start a new bearish trend. Support below here can be found at $0.48, followed by the $0.40 round level. Lower still we find a cluster of potential support levels at $0.337, $0.35, $0.374 and $0.388. A clearing of this area could lead to more losses. On the longer-term charts (both weekly and monthly) PPC is back in bullish mode.
Namecoin up by 28 Percent
Compared to Peercoin, NMC/USD is up by a more modest 28 percent. We are currently trading at $0.828, 18 cents above the $0.646 price noted two weeks ago.
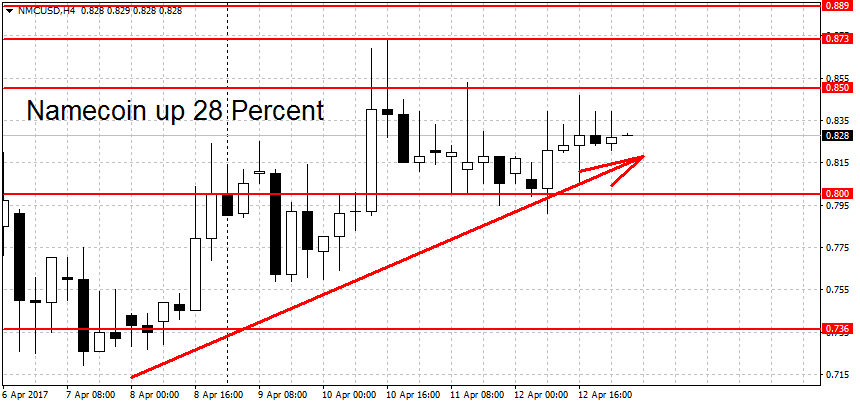
Nonetheless, these gains were more than enough to keep the coin in its uptrend. A break below $0.612 dollars per coin would end the current rally. For a new downtrend, the bears need a clean move below the $0.495 swing low. More support below can be found at the former $0.292 swing high, the 30 cents round figure and the September resistance at $0.32 dollars. Clearing of these levels could lead to more NMC losses.
Above current prices, this month’s high at $0.889 may present some challenges to the bulls. The $1 parity level is a tested resistance, prices topped out here earlier this month (at $0.985 to be exact). A breakout above this round figure could lead to extended gains. Further up the two-year high at $1.30 dollars is another potential resistance level. On the longer-term charts, the weekly is bullish but the monthly chart remains in neutral mode.
Trade cryptocurrency online with FXOpen broker.
FXOpen offers the world's most popular cryptocurrency CFDs*, including Bitcoin and Ethereum. Floating spreads, 1:2 leverage — at your service (additional fees may apply). Open your trading account now or learn more about crypto CFD trading with FXOpen.
*Important: At FXOpen UK, Cryptocurrency trading via CFDs is only available to our Professional clients. They are not available for trading by Retail clients. To find out more information about how this may affect you, please get in touch with our team.
This article represents the opinion of the Companies operating under the FXOpen brand only. It is not to be construed as an offer, solicitation, or recommendation with respect to products and services provided by the Companies operating under the FXOpen brand, nor is it to be considered financial advice.
Stay ahead of the market!
Subscribe now to our mailing list and receive the latest market news and insights delivered directly to your inbox.


Latest articles

DAX 40: consolidation amid technology sell-off
A wave of selling in the technology sector that emerged earlier this week has weighed on European equities. The trigger was investor concern over the profitability of large-scale debt-funded investments by major US tech companies in AI infrastructure. The Nasdaq

Euro Hits Fresh Yearly Lows Amid Dovish ECB Signals
The euro remains under pressure following weak macroeconomic data from the euro area and fresh signals that the European Central Bank is prepared to maintain a more accommodative monetary policy stance. Data released yesterday pointed to a deterioration in business

Pound at Key Levels: Markets Assess Impact of Political Uncertainty in the UK
The British pound remains under pressure following increased political uncertainty in the United Kingdom triggered by the Prime Minister’s resignation. Investors are assessing potential shifts in the political and economic policy outlook after the head of government stepped down,