


A Bearish Gap on the Brent Crude Oil Chart
FXOpen

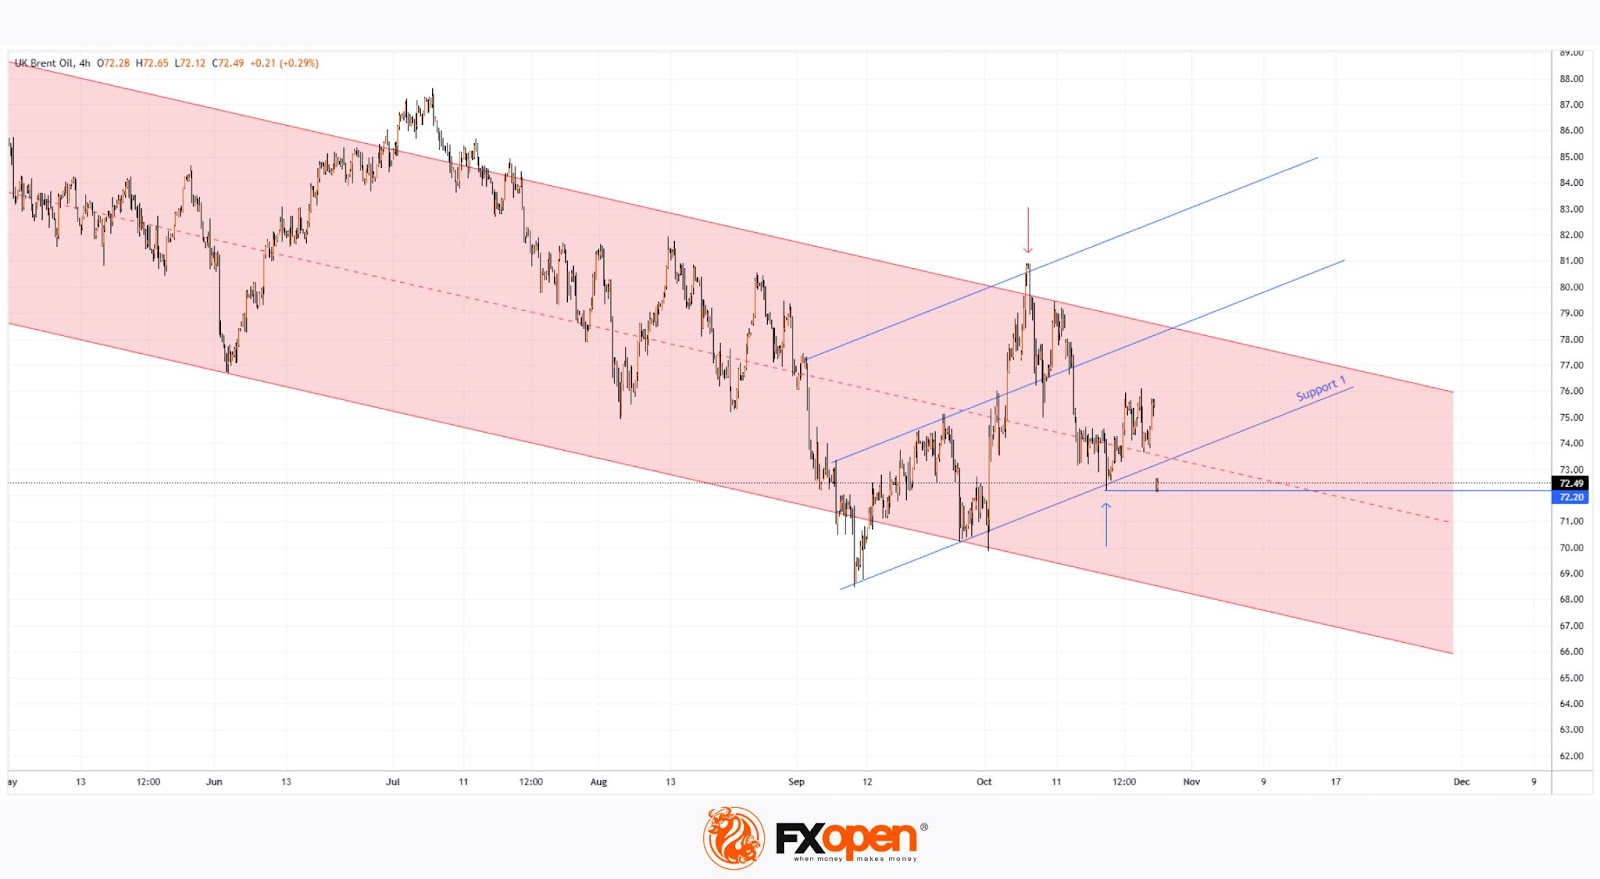
As the XBR/USD chart shows, Brent crude oil prices formed a gap at the start of this week: while Friday’s session closed at 75.60, Monday’s opening price dropped below 72.60.
According to Reuters, this development is tied to the fact that Israel’s recent missile strike on Iran did not impact oil or nuclear facilities, reducing the immediate risk of escalation.
Will Brent Crude Oil Prices Continue Falling?
In terms of technical analysis for XBR/USD today:
→ The price is within a descending channel (shown in red) that has been active since early summer. A bullish breakout attempt on 7 October was unsuccessful (marked by a red arrow), and Brent crude has since dropped over 10%. Price consolidation between 17-22 October near the median of this red channel confirms its current relevance.
→ Bulls had an opportunity to show strength with a bounce (marked by a blue arrow) from Support Line 1, which forms part of an upward structure represented by blue lines. However, today’s bearish gap erased these gains.
This allows traders to consider two scenarios:
→ Bearish Scenario: After breaking below Support, Brent could continue along the red descending channel. If the channel’s median line holds as resistance, this bearish outlook may be confirmed.
→ Bullish Scenario: Today’s bearish breach of the 18 October low could prove false, leading to a potential recovery back toward the structure of three blue lines.
Ultimately, which scenario plays out will largely depend on volatile news related to geopolitical tensions, the U.S. presidential election, and economic data from major economies.
Start trading commodity CFDs with tight spreads (additional fees may apply). Open your trading account now or learn more about trading commodity CFDs with FXOpen.
This article represents the opinion of the Companies operating under the FXOpen brand only. It is not to be construed as an offer, solicitation, or recommendation with respect to products and services provided by the Companies operating under the FXOpen brand, nor is it to be considered financial advice.
Stay ahead of the market!
Subscribe now to our mailing list and receive the latest market news and insights delivered directly to your inbox.


Latest articles

AUD/CAD: Months of Indecision — Is a Breakout Finally Coming?
The Australian dollar has clawed back most of its end-of-June losses, when it touched three-month lows against the greenback amid escalating Middle East tensions. Since then, sentiment has improved: the RBA's Assistant Governor Sarah Hunter signalled the board stands ready

USD/JPY: Battling at the Top of the Triangle
On 3 July, Japan's Finance Minister, Satsuki Katayama, stated that the Ministry of Finance remains in close contact with US authorities regarding developments in USD/JPY as the yen traded near its weakest level in almost 40 years. Similar verbal

Dow Jones (DJIA): Consolidation Beyond the Trend
Federal Reserve Chair Kevin Warsh testified before Congress on 14–15 July, reaffirming the Fed's commitment to bringing inflation back to target while providing no clear guidance on the future path of interest rates. Meanwhile, June inflation data came in