


AAPL Share Price Falls More Than 4% after Antitrust Lawsuit
FXOpen

Yesterday, the Department of Justice filed an antitrust lawsuit against Apple, alleging that the company has established a monopoly with the iPhone, which has harmed consumers, developers and competitors.
“Each step in Apple's course of conduct built and reinforced the moat around its smartphone monopoly,” the government said in the 88-page lawsuit.
The result of news of the lawsuit was a sharp decline in Apple's share price by more than 4%. This is a serious blow to stocks that are already underperforming the broader market. As confirmation, we note that yesterday, the ratio of the S&P 500 index to the AAPL share price set a maximum since November 2021.
The chart for AAPL stock shows an increasingly bearish picture:
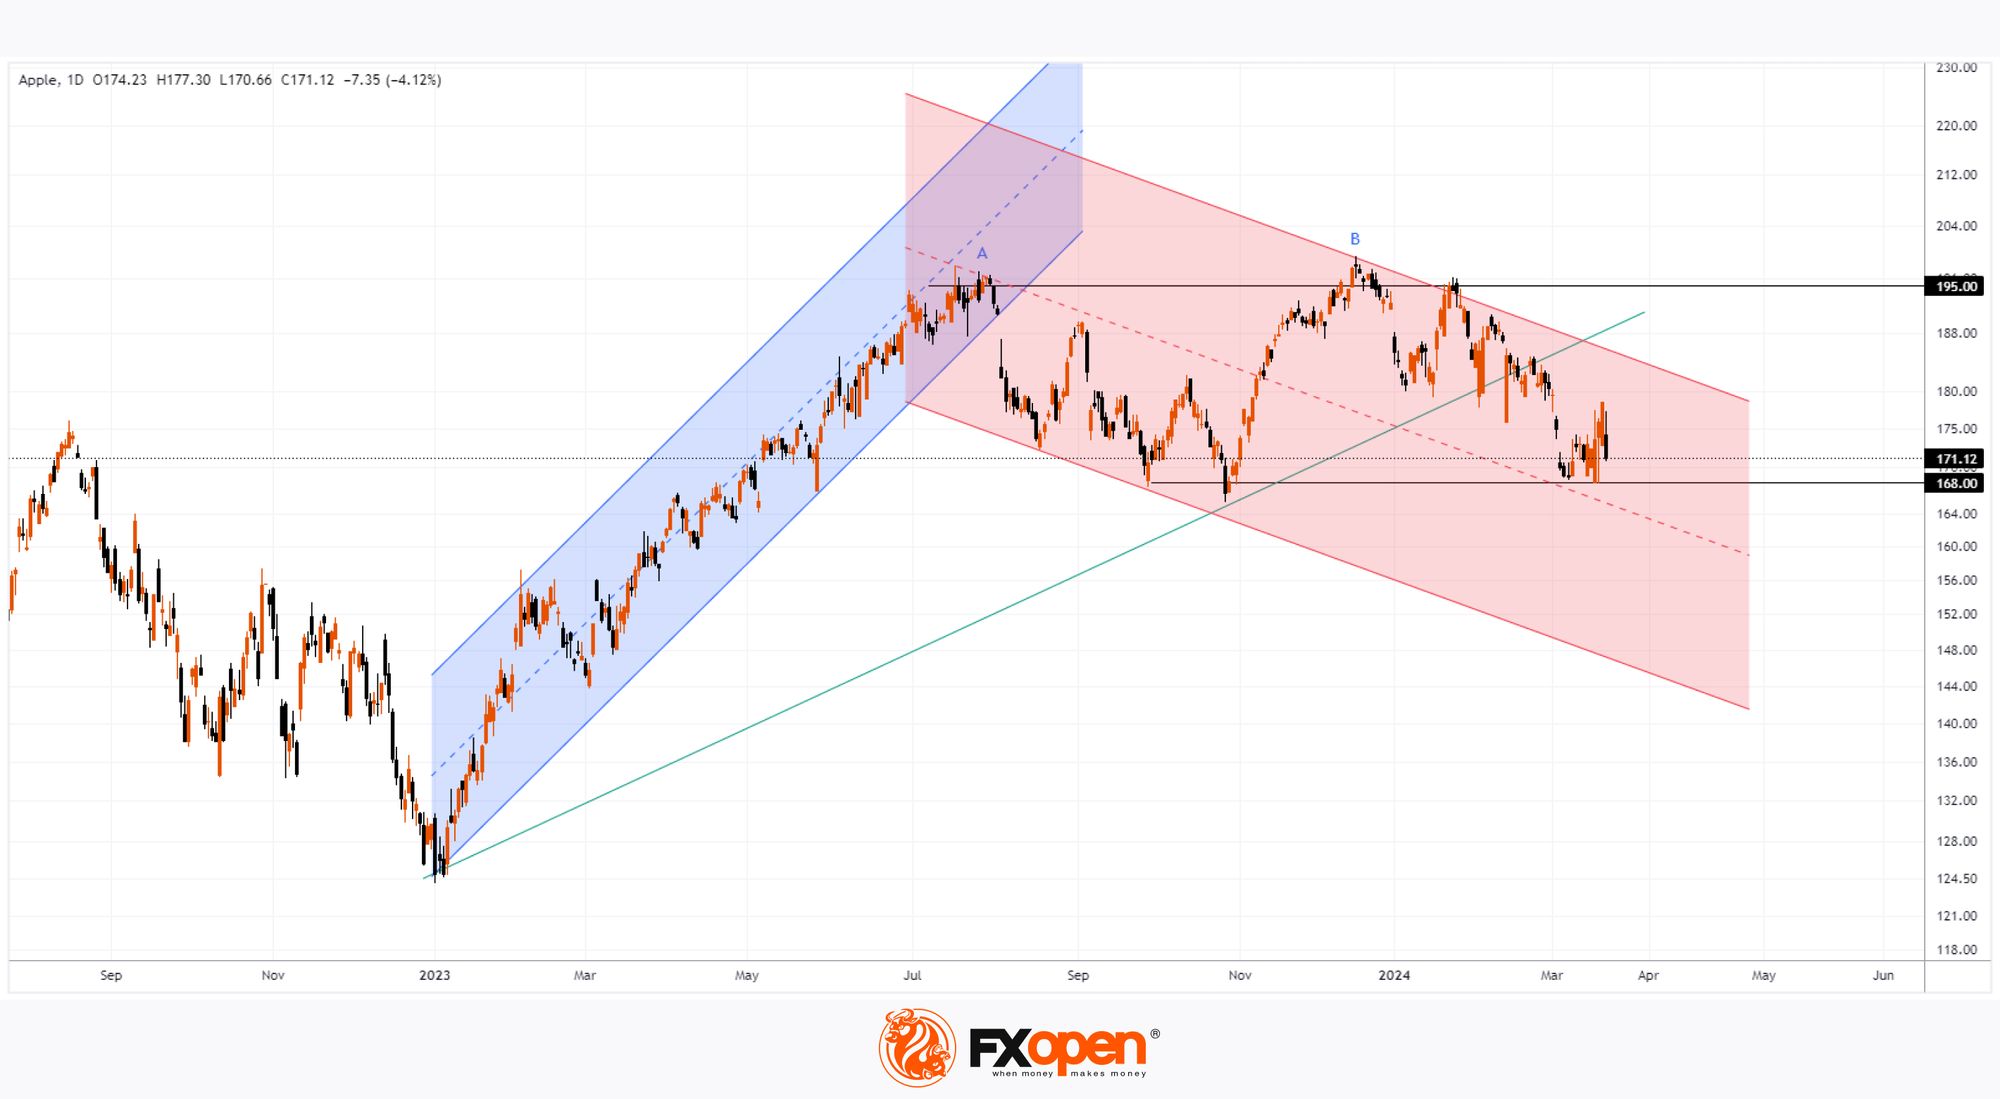
→ The pace of the strong bull run (shown in the blue channel) of 2023 remains in the past, forming an A top near the USD 195 per share level of AAPL.
→ The price tested this level, forming top B.
→ Thus, the level of USD 195 works as an important resistance, around which a double top A-B pattern has formed (subjectively, it can be regarded as a triple, taking into account the high of January 24.
→ Price action increasingly defines the contours of the downward channel (shown in red).
→ While developing within this channel, the price has already dropped below the uptrend line (shown in green).
As we wrote earlier, analysts fear a decline in sales of Apple products. If the negativity in the market increases, the bears may attempt to break through the support level of USD 168 per share.
The company's report for the 1st quarter of 2024 will have an important impact, its publication is scheduled for April 25. But for now, analysts believe more in a positive scenario - according to TipRanks, the average predicted price for AAPL shares is $204.86 in 12 months.
Buy and sell stocks of the world's biggest publicly-listed companies with CFDs on FXOpen’s trading platform. Open your FXOpen account now or learn more about trading share CFDs with FXOpen.
This article represents the opinion of the Companies operating under the FXOpen brand only. It is not to be construed as an offer, solicitation, or recommendation with respect to products and services provided by the Companies operating under the FXOpen brand, nor is it to be considered financial advice.
Stay ahead of the market!
Subscribe now to our mailing list and receive the latest market news and insights delivered directly to your inbox.


Latest articles

Ethereum: Has the Recovery Begun?
Ethereum has staged a notable rebound after once again testing the heavily watched psychological zone around 1500$. Since bouncing off this support, ETH/USD has climbed roughly 13%, now trading around the $1,700 mark.
This recovery is being driven

Oil Prices Are Back at Pre-Conflict Levels. Analysts Are Divided
At the start of May, oil markets were still pricing in elevated geopolitical risk and expectations of sustained supply disruption.
But easing tensions between Washington and Tehran, along with improving supply expectations, have rapidly shifted sentiment back toward fundamentals.
📉 Brent

The Dollar Awaits the Week’s Key Report: AUD/USD and NZD/USD at Crucial Technical Levels
Following mixed performance by the US dollar earlier this week, investors are now fully focused on the June Nonfarm Payrolls report, which will be released on Thursday rather than Friday. The schedule has been brought forward as US financial markets