


FXOpen

On June 5th in the article "Is ADBE Stock Undervalued?", we highlighted several bullish signs, suggesting that the report published on June 13th could be a driver for a resumption of the uptrend.
Adobe's report released on June 13th proved to be strong:
→ Earnings per share: Actual = $4.48, Forecast = $4.39;
→ Revenue: Actual = $5.309 billion, Forecast = $5.291 billion. A 10% increase compared to the same quarter last year.
Furthermore, the company stated that:
→ AI is more of an advantage than a hindrance to business development;
→ “We’re seeing early success monetizing new AI technologies across our Digital Media and Digital Experience businesses,” said Shantanu Narayen, Adobe's CEO.
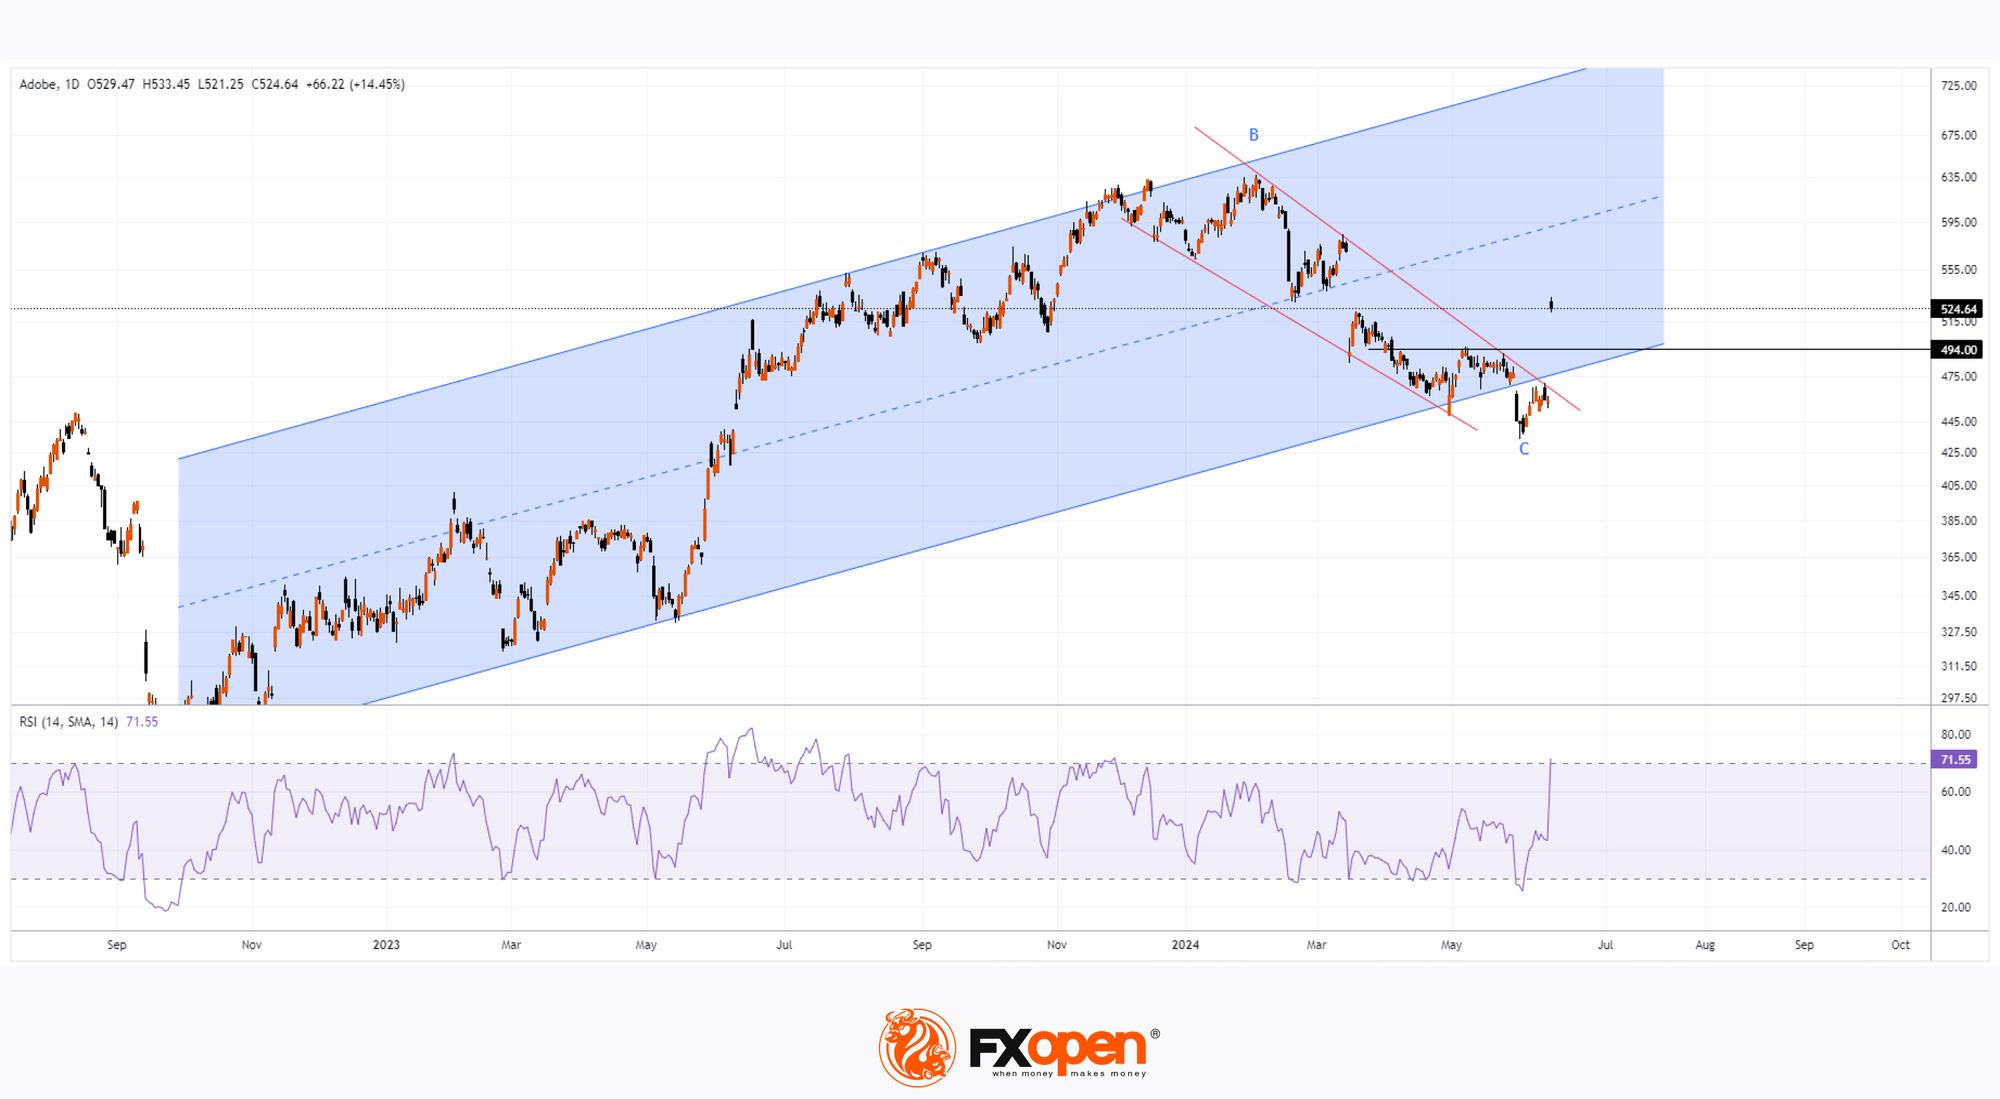
Technical analysis of Adobe's stock shows that:
→ The price has returned to an upward channel (shown in blue) starting from 2023;
→ The price broke a descending formation (shown with red lines), potentially marking a significant correction from point A to point B by approximately 50%;
→ The price surpassed the psychological mark of $500 per share;
→ The price is in the area of the bearish gap from March 15th, which may act as resistance.
Although the RSI indicator on the daily chart of Adobe's stock was in oversold territory at the end of May, today it indicates overbought conditions. There is a possibility that a correction may follow the sharp change in market sentiment, associated with a more thorough evaluation of Adobe's stock prospects.
In such a scenario, support for Adobe's stock price may come from:
→ The psychological level at $500;
→ The lower boundary of the channel;
→ Former resistance at $494.
According to TipRanks, the average price target for Adobe's stock is $613 in 12 months, indicating a growth potential of +16% from current levels.
Buy and sell stocks of the world's biggest publicly-listed companies with CFDs on FXOpen’s trading platform. Open your FXOpen account now or learn more about trading share CFDs with FXOpen.
This article represents the opinion of the Companies operating under the FXOpen brand only. It is not to be construed as an offer, solicitation, or recommendation with respect to products and services provided by the Companies operating under the FXOpen brand, nor is it to be considered financial advice.
Stay ahead of the market!
Subscribe now to our mailing list and receive the latest market news and insights delivered directly to your inbox.


Latest articles

Market Analysis: GBP/USD Dips Further As EUR/GBP Regains Traction
GBP/USD failed to climb above 1.3500 and corrected some gains. EUR/GBP started a decent increase and might aim for more gains above 0.8700.
Important Takeaways for GBP/USD and EUR/GBP Analysis Today
· The British Pound


Market Insights with Gary Thomson: Oil, US Retail Sales & NFP in Focus
In this video, we’ll explore the key economic events and market trends, shaping the financial landscape. Get ready for insights into financial markets to help you navigate the week ahead. Let’s dive in!
In this episode of Market