


After Earnings Report, NVDA Stock Price Exceeds $1,000
FXOpen

For the first time in history, Nvidia's stock price has reached a four-digit number, and its market capitalisation has surpassed $2.5 trillion, ranking third globally after Microsoft and Apple. This surge is due to a strong earnings report, driven by high demand for AI chips:
→ Earnings per share: actual = $6.12, expected = $5.60;
→ Gross revenue: actual = $26.04 billion, expected = $24.59 billion.
Additionally, Nvidia announced a 10-for-1 stock split to make shares more accessible and attract new investors, which should support NVDA stock in the future.
While yesterday's main trading session closed around $950 per share, the price rose by approximately 6% in after-hours trading. Thus, NVDA's stock price has increased by over 100% since the beginning of the year. Can the rally continue?
On March 28, in the article "Stock Market Analysis: NVDA Losing Leadership?", we:
→ Noted signs of weakness relative to the S&P 500 index;
→ Constructed an ascending blue channel;
→ Suggested a potential pullback to the $800 level.
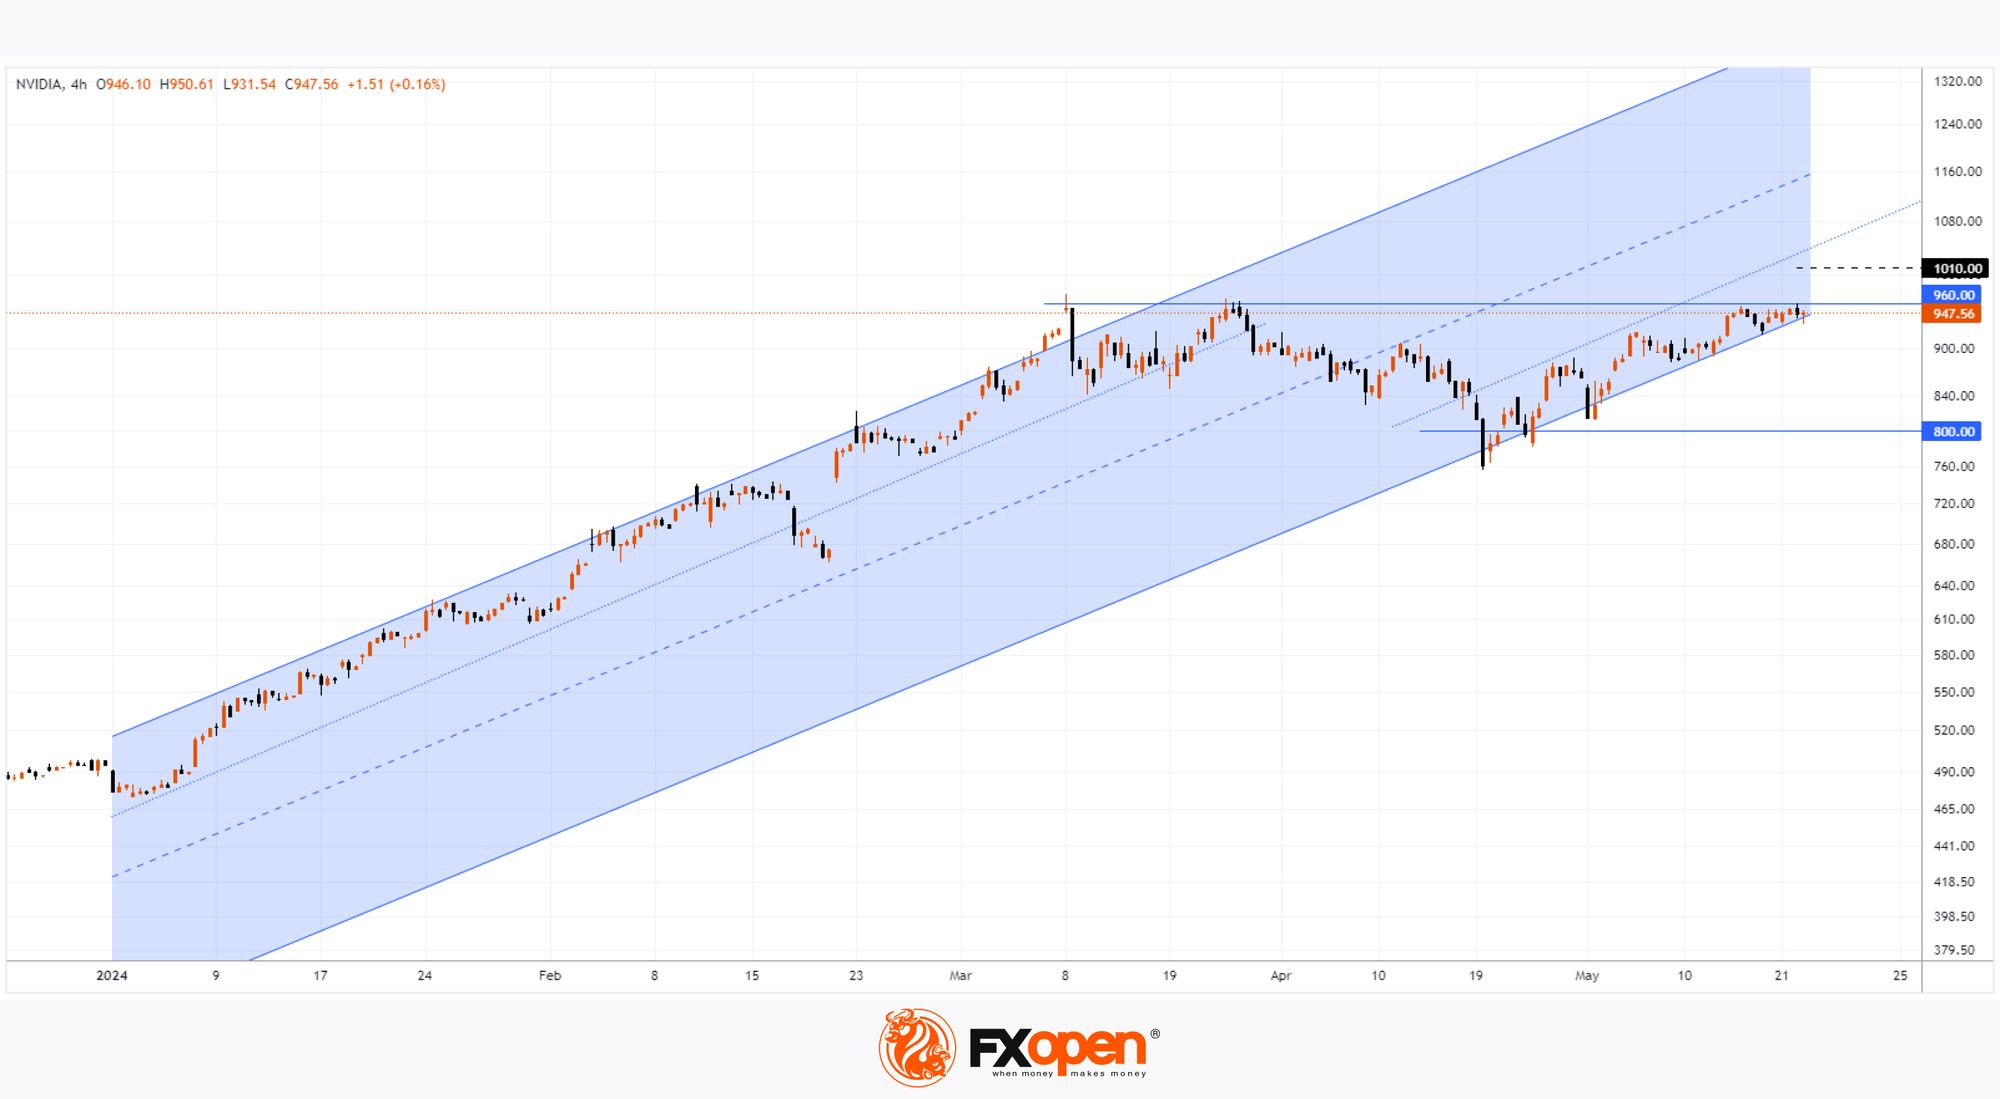
The NVDA chart shows that after these signs of weakness, the price dropped to the lower boundary of the channel on April 19, briefly falling below $800. However, the bulls then attempted to resume the upward trend, and it paid off.
Given NVDA's pre-market price, it is reasonable to assume today's main session will open around $1,010. Therefore, technical analysis of the NVDA daily chart today shows:
→ The price remains within the ascending channel;
→ The price is breaking through the $960 level with a bullish gap, which can now be expected to act as support;
→ If the bullish momentum from the earnings report continues (as it did on February 22), NVDA's price could approach the median line of the ascending channel.
According to TipRanks, the average analyst target price for NVDA is $1,104.62, but this target may be raised considering Nvidia's strong forecasts for the next quarter.
Buy and sell stocks of the world's biggest publicly-listed companies with CFDs on FXOpen’s trading platform. Open your FXOpen account now or learn more about trading share CFDs with FXOpen.
This article represents the opinion of the Companies operating under the FXOpen brand only. It is not to be construed as an offer, solicitation, or recommendation with respect to products and services provided by the Companies operating under the FXOpen brand, nor is it to be considered financial advice.
Stay ahead of the market!
Subscribe now to our mailing list and receive the latest market news and insights delivered directly to your inbox.


Latest articles

Weekly Market Insights with Gary Thomson: US Inflation, UK GDP, Chair Warsh Testimony, and Earnings
In this video, we’ll explore the key economic events and market trends, shaping the financial landscape. Get ready for insights into financial markets to help you navigate the week ahead. Let’s dive in!
In this episode of Market

GBP/AUD Analysis: The Tug-of-War Begins
Oil is back in the driver's seat, and both the pound and the aussie are feeling its grip. The Bank of England held rates at 3.75% in June, but with UK inflation at 2.8% and crude oil climbing

Australian Dollar Holds Above the Current Market Profile
The minutes from the Reserve Bank of Australia's (RBA) June meeting, released on 30 June, suggested that policymakers are not yet ready to rule out further policy tightening. Board members noted persistent excess demand and broad-based inflationary pressures across the