


FXOpen

As shown on the Alibaba Group (BABA) stock chart, the price surpassed $107 on the NYSE on Friday, after trading below $85 at the start of the month.
Bullish sentiment surrounding Chinese stocks is driven by the authorities' plans to stimulate the country's economy:
→ According to Benzinga, China’s Central Bank shared plans last week to lower the banks’ required reserve ratio (RRR);
→ The Central Bank also outlined further support measures for the struggling real estate market.
It appears that market participants expect these economic stimulus measures to benefit Alibaba Group (BABA).
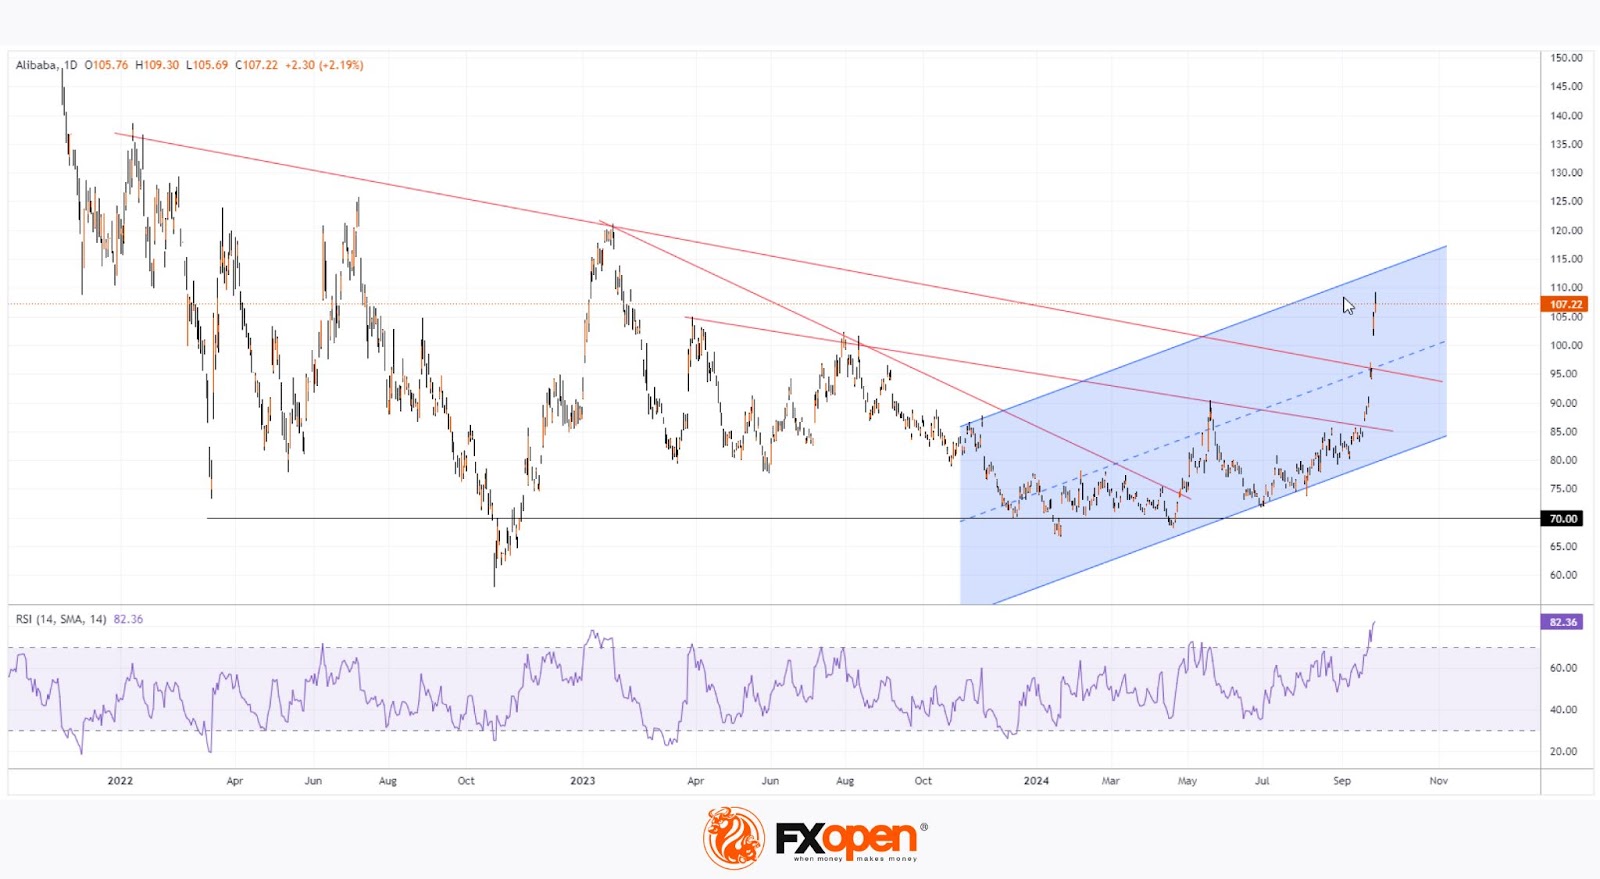
Technical analysis of the Alibaba Group (BABA) stock chart reveals:
→ The historical high above $300 was reached in October 2020, after which bears dominated the market. Signs of bullish activity emerged between 2022 and 2024 as the stock fell to $70.
→ In 2024, the price broke through three descending trendlines (marked in red) drawn through key highs, and the price movements suggest a new upward channel is forming (marked in blue).
→ The RSI indicator is at a multi-month high, signalling strong overbought conditions, while Friday’s candle closed with a long upper wick (a sign of increased bearish activity).
Although the current bullish momentum may still have room to lift Alibaba Group (BABA) shares to the upper boundary of the blue channel, given the information above, there is a significant likelihood of a correction forming in early October.
Buy and sell stocks of the world's biggest publicly-listed companies with CFDs on FXOpen’s trading platform. Open your FXOpen account now or learn more about trading share CFDs with FXOpen.
This article represents the opinion of the Companies operating under the FXOpen brand only. It is not to be construed as an offer, solicitation, or recommendation with respect to products and services provided by the Companies operating under the FXOpen brand, nor is it to be considered financial advice.
Stay ahead of the market!
Subscribe now to our mailing list and receive the latest market news and insights delivered directly to your inbox.


Latest articles

Market Analysis: GBP/USD Dips Further As EUR/GBP Regains Traction
GBP/USD failed to climb above 1.3500 and corrected some gains. EUR/GBP started a decent increase and might aim for more gains above 0.8700.
Important Takeaways for GBP/USD and EUR/GBP Analysis Today
· The British Pound


Market Insights with Gary Thomson: Oil, US Retail Sales & NFP in Focus
In this video, we’ll explore the key economic events and market trends, shaping the financial landscape. Get ready for insights into financial markets to help you navigate the week ahead. Let’s dive in!
In this episode of Market